


EUR/USD
Higher timeframes
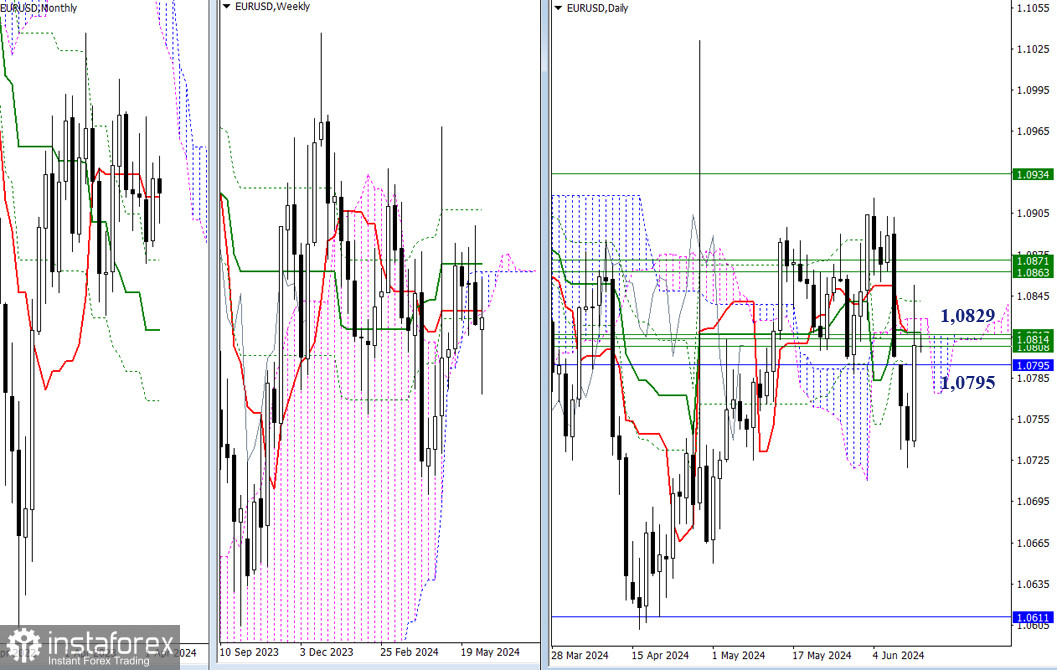
The bulls have returned to the area of different levels on the higher timeframes (1.0795 – 1.0829). These levels exert influence on the current situation's progress. The bulls' objective is to enter the positive territory relative to the weekly cloud (1.0862), which requires overcoming the cloud resistance of the weekly mid-term trend (1.0871). Afterwards, the bulls will focus on breaking through and eliminating the weekly Ichimoku dead cross (1.0934), after which new prospects will appear for them.
H4 – H1
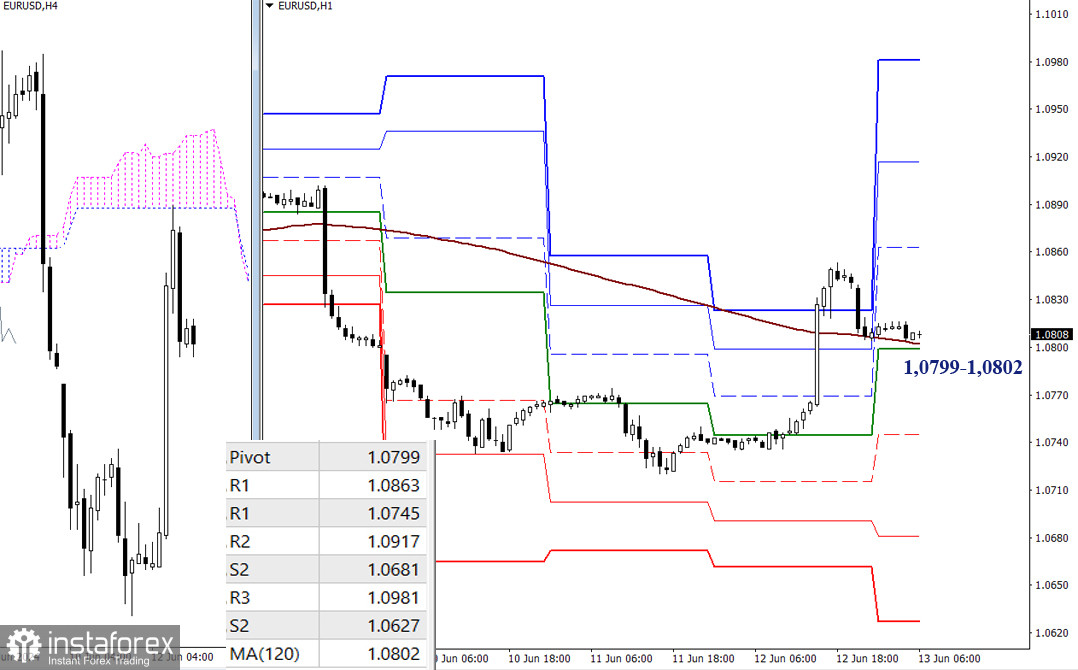
On the lower timeframes, the market is currently working in the area of key levels 1.0799 – 1.0802 (central Pivot level + weekly long-term trend), indicating uncertainty while pondering the next direction. To push the pair to move in a particular direction, the classic Pivot levels will serve as references. For the bulls, the important resistances are (1.0863 – 1.0917 – 1.0981), while the bears will need the support levels (1.0745 – 1.0681 – 1.0627).
***
GBP/USD
Higher Timeframes
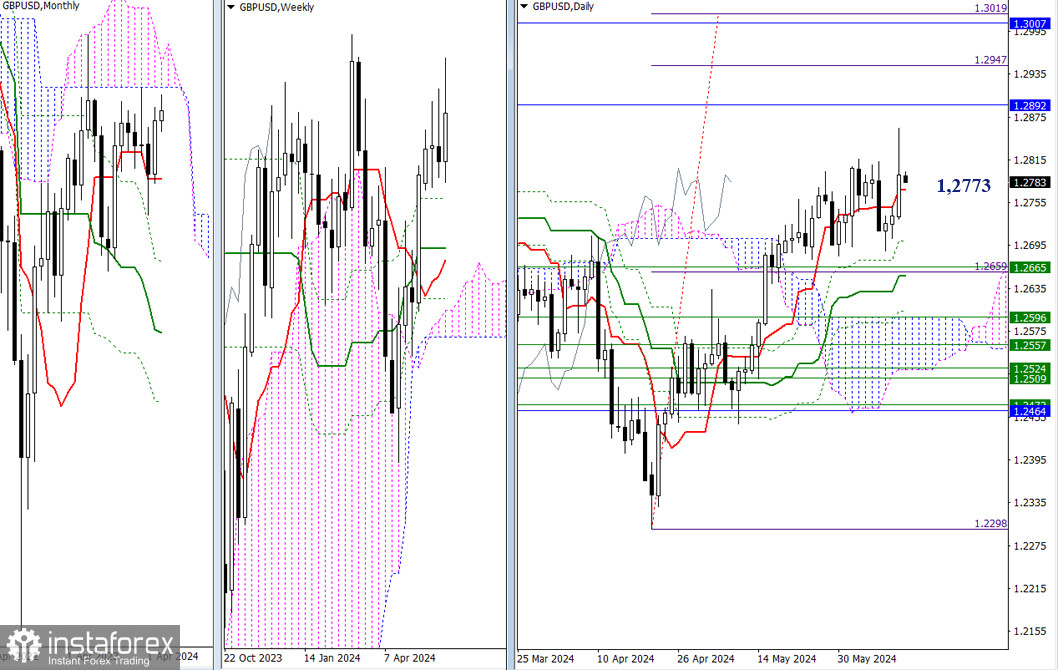
The bulls have updated the high, although they have not yet managed to close above it. The bullish prospects currently maintain their position and significance – the monthly cloud (1.2892 – 1.3007) and the daily target for breaking through the Ichimoku cloud (1.2947 – 1.3019). In case GBP/USD corrects lower, the first support levels that the market will encounter are from the daily Ichimoku cross (1.2773 – 1.2701 – 1.2652), reinforced by the weekly Fibonacci Kijun (1.2665).
H4 – H1
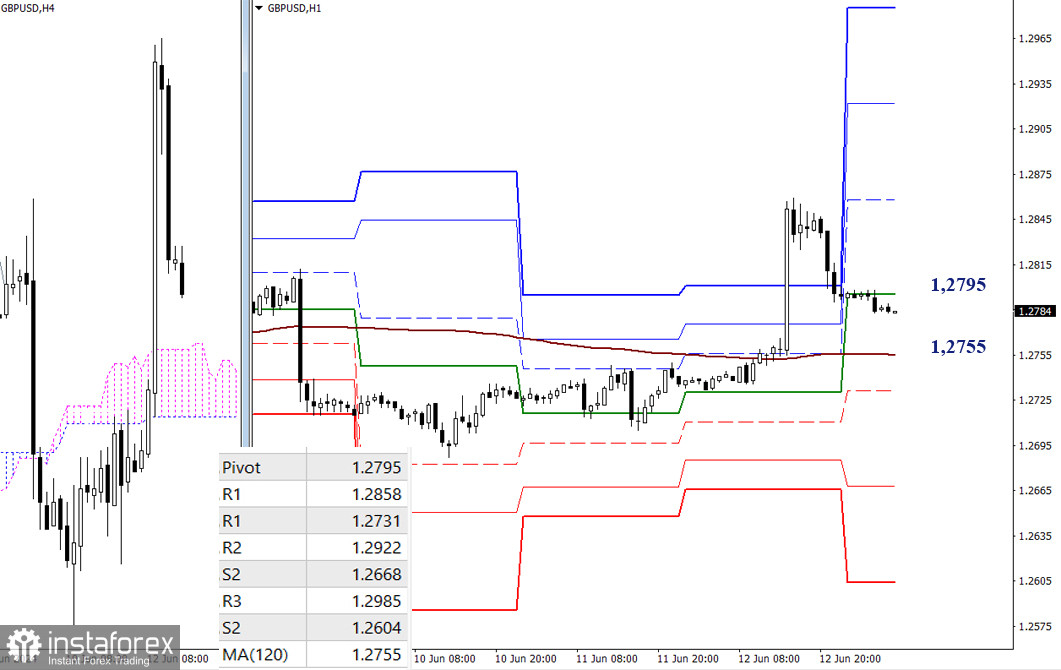
At the moment, the bulls have the main advantage on the lower timeframes. Nevertheless, there is a rather effective corrective decline, with the weekly long-term trend (1.2755) acting as a reference. This trend is responsible for the current balance of power. The classical Pivot levels serve as reference points for the progress of intraday movements. To strengthen the bullish bias, it is necessary to overcome the resistances at 1.2858 – 1.2922 – 1.2985, while for the bears, it is important to break through the supports at 1.2731 – 1.2668 – 1.2604.
***
The technical analysis of the situation uses:
Higher timeframes - Ichimoku Kinko Hyo (9.26.52) + Fibonacci Kijun levels
Lower timeframes - H1 - Pivot Points (classic) + Moving Average 120 (weekly long-term trend)


