EUR/USD

Higher timeframes
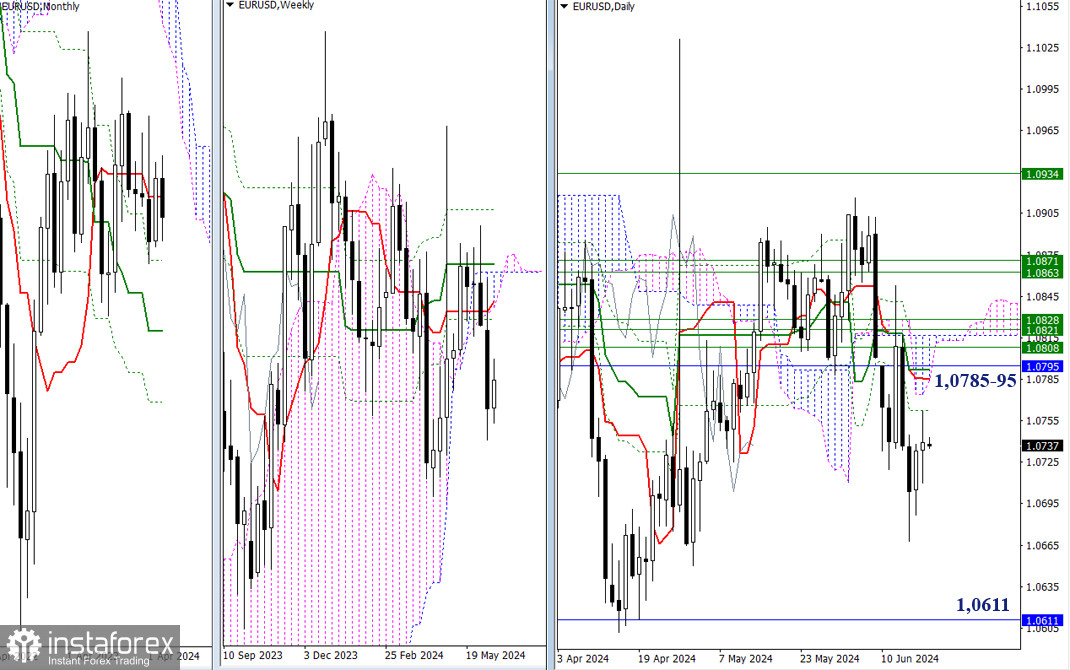
Yesterday, the bulls tested the daily resistance level of 1.0763. A sustained rise will bring EUR/USD to the next reinforced resistance area of 1.0785 – 1.0795 (daily Tenkan + Kijun + monthly short-term trend). Beyond this, the bulls will have to face several more obstacles. However, if a rebound forms from 1.0763, it is important to test the low (1.0668) and resume the decline, with the target located at the threshold of 1.0611.

H4 – H1
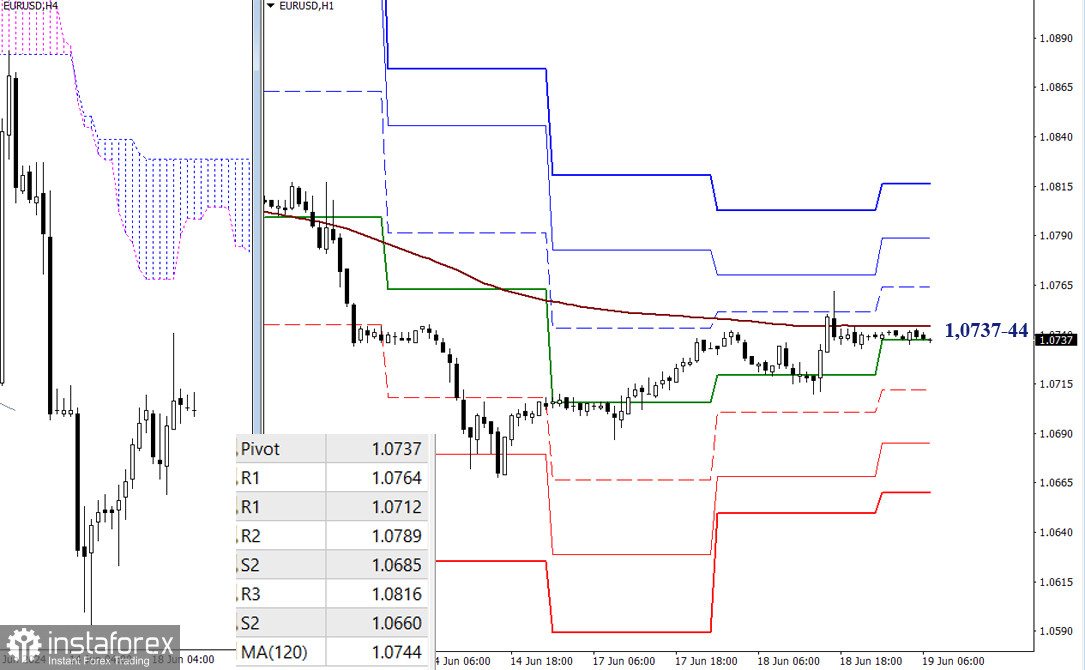
On the lower timeframes, key levels have combined their efforts within a narrow range of 1.0737-44 (central Pivot level of the day + weekly long-term trend) and have pulled the market into their zone of influence. Keeping this position for several hours makes things uncertain. It is not clear as to which side has the main advantage right now. In case EUR/USD moves towards a certain direction during the day, the classic Pivot levels will serve as benchmarks. For the bulls, resistances at 1.0764 – 1.0789 – 1.0816 will be important, while the bears can look to the supports at 1.0712 – 1.0685 – 1.0660.
***
GBP/USD

Higher timeframes
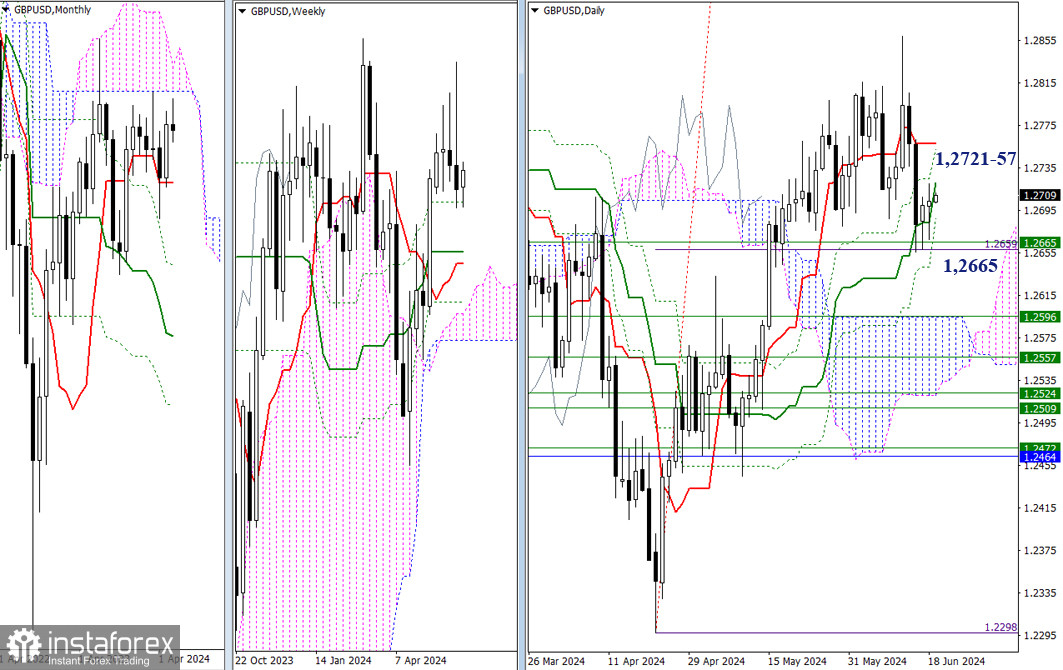
The market continues to slow down and ponder, leaning on the weekly support at 1.2665. Meanwhile, the daily Ichimoku cross levels are changing, trying to alter the pattern and purpose of this Ichimoku indicator. In this situation, they can provide resistance at the thresholds of 1.2721 (Kijun) and 1.2757 (Tenkan). Surpassing these boundaries will allow the market to move out of the uncertain area, potentially initiating a specific direction.

H4 – H1
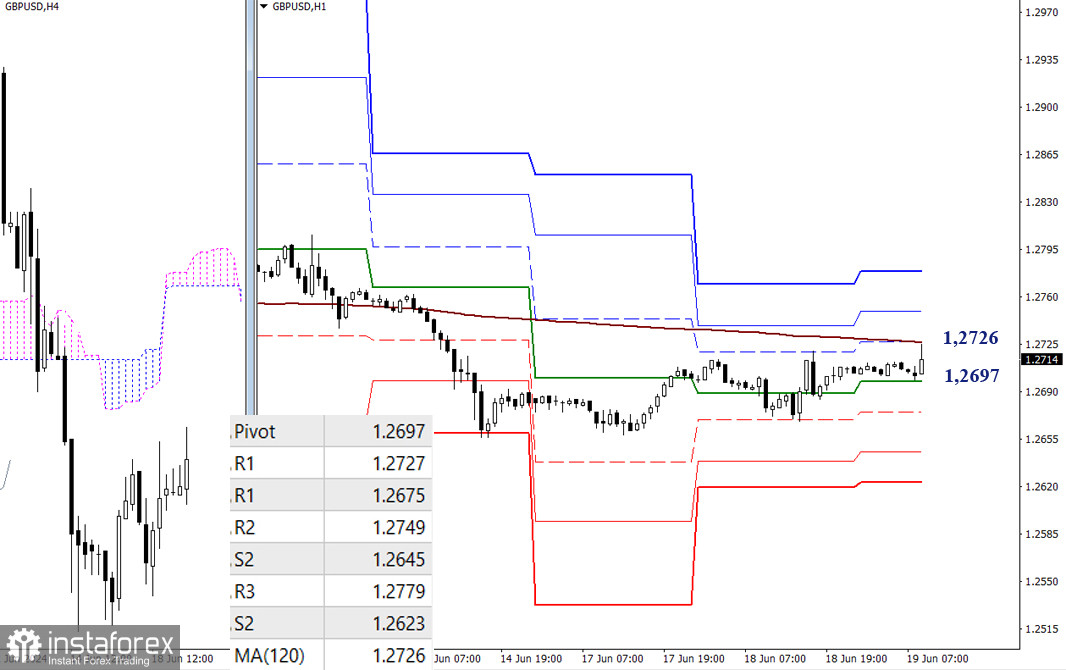
The bears have the main advantage on the lower timeframes, but the market is currently testing the weekly long-term trend (1.2726). Consolidating above this trend as well as a reversal can change the current balance of power in favor of the bulls. The next intraday bullish targets will be the resistances of the classic Pivot levels (1.2749 and 1.2779). A rebound from the trend and testing the recent days' low (1.2656) may bring back the bearish bias. Classic Pivot levels (1.2675 – 1.2645 – 1.2623) will provide additional intraday supports.
***
The technical analysis of the situation uses:
Higher timeframes - Ichimoku Kinko Hyo (9.26.52) + Fibonacci Kijun levels
Lower timeframes - H1 - Pivot Points (classic) + Moving Average 120 (weekly long-term trend)


