Overview of trading and tips on USD/JPY
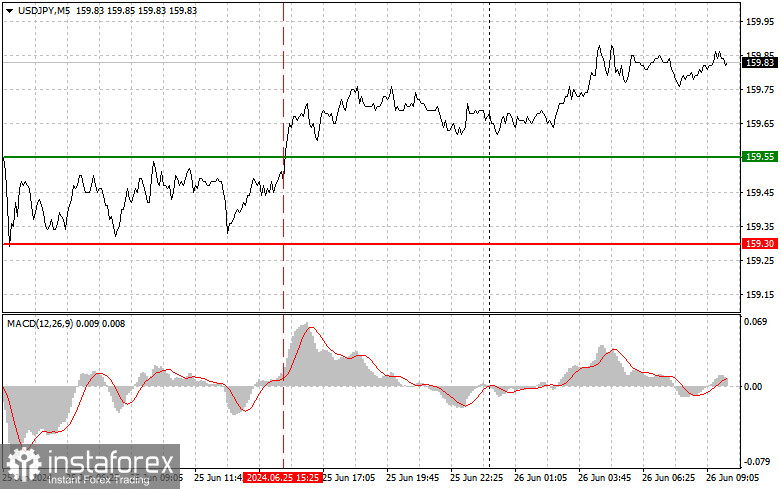
The levels I mentioned were not tested in the second half of the day. Reports on the corporate services price index, the Bank of Japan's core consumer price index, and the leading economic indicators index led to a surge in volatility, but that was the end of it. A decent report on the US consumer confidence index, although it decreased, turned out better than economists' forecasts, which supported the dollar, pushing USD/JPY to new annual highs. Today, the pair has every chance to continue the upward trend, but the likelihood of a Bank of Japan currency intervention is also high. So be cautious with buying at the current levels. As for the intraday strategy, I will rely more on the implementation of scenarios No. 1 and 2.

Buy signals
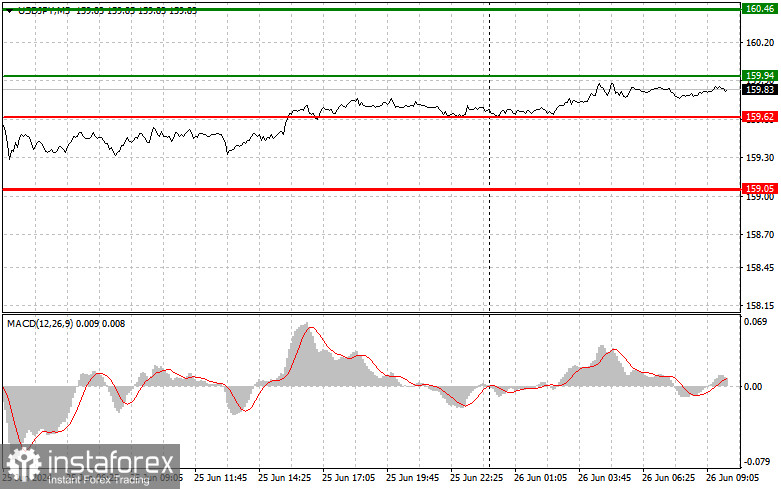
Scenario No. 1. Today, I plan to buy USD/JPY when the price reaches the entry point at 159.94 plotted by the green line on the chart, aiming for growth to 160.46 plotted by the thicker green line on the chart. Around 160.46, I'm going to exit long positions and open short ones in the opposite direction, expecting a movement of 30-35 pips in the opposite direction from that level. You can count on the pair to rise today in continuation of the bullish progress. Before buying, make sure that the MACD indicator is above the zero mark and is just starting to rise from it.
Scenario No. 2. I also plan to buy USD/JPY today in case of two consecutive tests of 159.62 when the MACD indicator is in the oversold area. This will limit the pair's downward potential and lead to a reverse market upturn. One can expect growth to the opposite levels of 159.94 and 160.46.
Sell signals
Scenario No. 1. I plan to sell USD/JPY today only after testing the level of 159.62 plotted by the red line on the chart, which will lead to a rapid decline in the price. The key target for sellers will be 159.05, where I am going to exit short positions and immediately open long ones in the opposite direction, expecting a movement of 20-25 pips in the opposite direction from that level. Pressure on USD/JPY may return in case the price fails to consolidate near the daily high. Before selling, make sure that the MACD indicator is below the zero mark and is just starting to decline from it.
Scenario No. 2. I also plan to sell USD/JPY today in case of two consecutive price tests at 159.94 when the MACD indicator is in the overbought area. This will limit the pair's upward potential and lead to a reverse market downturn. One can expect a decline to the opposite levels of 159.62 and 159.05.

What's on the chart:
The thin green line is the entry price at which you can buy the trading instrument.
The thick green line is the estimated price where you can set Take-Profit (TP) or manually close positions, as further growth above this level is unlikely.
The thin red line is the entry price at which you can sell the trading instrument.
The thick red line is the price where you can set Take-Profit (TP) or manually close positions, as further decline below this level is unlikely.
MACD line: it is important to be guided by overbought and oversold areas when entering the market
Important: Novice traders in the forex market need to be very careful when making decisions to enter the market. It is best to stay out of the market before important fundamental reports are released to avoid getting caught in sharp price fluctuations. If you decide to trade during news releases, always place stop orders to minimize losses. Without setting stop orders, you can quickly lose your entire deposit, especially if you don't use money management and trade in large volumes.
And remember, for successful trading, it is necessary to have a clear trading plan, similar to the one I presented above. Spontaneously making trading decisions based on the current market situation is inherently a losing strategy for an intraday trader.


