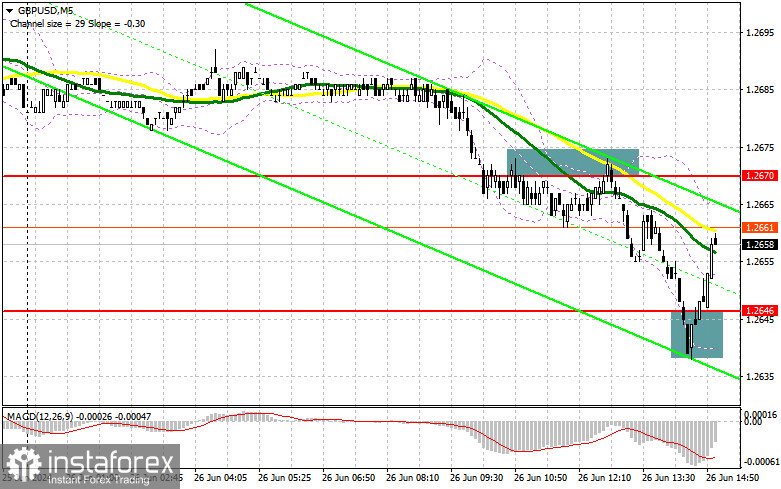
In my morning forecast, I paid attention to the 1.2670 level and planned to make decisions on entering the market from it. Let's look at the 5-minute chart and figure out what happened there. A breakout and a reverse test of this range led to an entry point for sale, which resulted in a drop to the area of 1.2646. Active buying actions allowed for a buying entry point, leading to a correction of the pair by 15 points. The technical outlook was reassessed for the second half of the day.

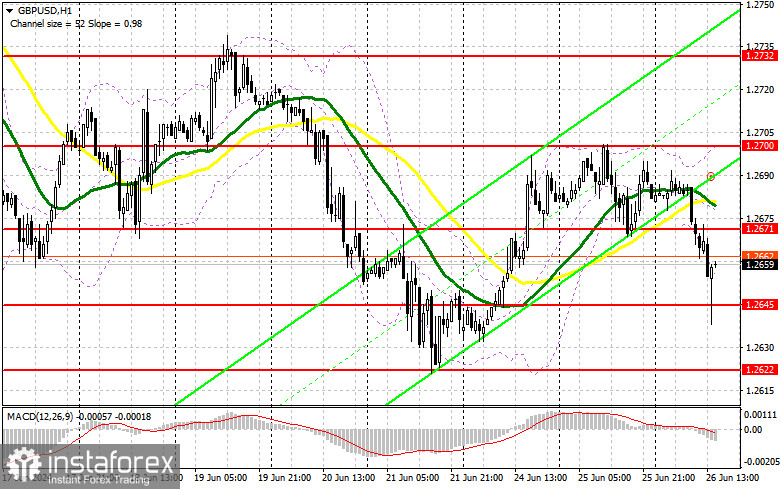
To open long positions on GBP/USD, the following is required:The pound quickly caught up with the euro, which was to be expected. The volume of new home sales in the US primary market is of interest to traders, but the absence of a strong divergence from economists' forecasts could provoke purchases of the pound. In the case of very good statistics and further decline of the pair, sellers should show up around the new support level of 1.2645, formed during the first half of the day. Only a false breakout there will provide an entry point for long positions with the target of a new upward wave towards the level of 1.2671, above which the moving averages, favoring sellers, are located. A breakout and a retest of this range from above to below will be a suitable condition for buying, targeting a retest of 1.2700 - the weekly high. The ultimate target will be around 1.2732, where I plan to make a profit.In the scenario of a GBP/USD decline and lack of activity from bulls at 1.2645 in the second half of the day, pound buyers will lose all initiative, increasing pressure on the pair. This will also lead to a decline and a test of the next support at 1.2622, which acts as the lower boundary of the sideways channel. Only a false breakout would be a suitable condition to open long positions. I plan to buy GBP/USD on a rebound from the minimum of 1.2606, with a target of a 30-35 point correction within the day.To open short positions on GBP/USD, the following is required:Sellers can take control of the market at any moment, and strong US data will be sufficient for this. In case of a bullish reaction to the reports, only a false breakout around the resistance at 1.2671 would be suitable for opening short positions with the target of lowering towards support at 1.2645. A breakout and retest from below to above – all of this will be a major blow to buyers, leading to stop-loss orders being triggered and opening the path to the lower boundary of the sideways channel at 1.2622. The ultimate target will be around 1.2606, where I will take profit. Testing this level will also indicate the formation of a bearish market.In the scenario of GBP/USD rising and lack of activity at 1.2671 in the second half of the day, buyers will regain initiative. In this case, I will postpone sales until a false breakout occurs at the level of 1.2700. If there is no downward movement even there, I will sell GBP/USD immediately on a rebound from 1.2732, but only anticipating a pair correction downwards by 30-35 points within the day.

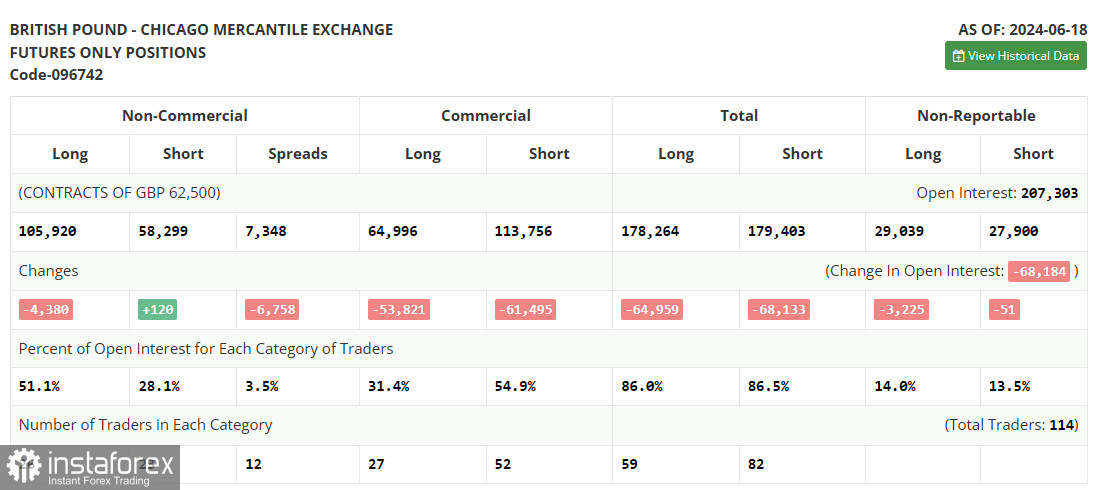
In the COT (Commitment of Traders) report for June 18, there was an increase in short positions and a slight reduction in long positions. The outcome of the Bank of England meeting, where it became known that rates in the UK could be lowered as soon as August this year, though not a revelation for traders, still influenced the market sentiment, leading to a sharp reduction in long positions. The significant difference with the policies and actions of the Federal Reserve, which recently kept interest rates unchanged, signaling only a potential rate cut later this year, maintains demand for the US dollar and favors its side. The latest COT report indicates that non-commercial long positions fell by 4,380 to 105,920, while non-commercial short positions increased by 120 to 58,299. As a result, the spread between long and short positions decreased by 6,785.

Signals from Indicators:Moving AveragesTrading is below the 30 and 50-day moving averages, indicating further decline in the pair.Note: The periods and prices of moving averages considered by the author are on the hourly chart (H1) and differ from the general definition of classic daily moving averages on the daily chart (D1).Bollinger BandsIn case of decline, the lower boundary of the indicator, around 1.2657, will act as support.Description of Indicators:
- Moving Average (MA): Determines the current trend by smoothing volatility and noise. Period - 50. Marked on the chart in yellow.
- Moving Average (MA): Determines the current trend by smoothing volatility and noise. Period - 30. Marked on the chart in green.
- MACD (Moving Average Convergence/Divergence): Fast EMA - period 12, Slow EMA - period 26, SMA - period 9.
- Bollinger Bands: Period - 20.
- Non–profit speculative traders, such as individual traders, hedge funds and large institutions that use the futures market for speculative purposes and meet certain requirements;
- Long non-commercial positions represent the total long open position of non-commercial traders; • Short non-commercial positions represent the total short open position of non-commercial traders;
- The total non-commercial net position is the difference between the short and long positions of non-commercial traders.


