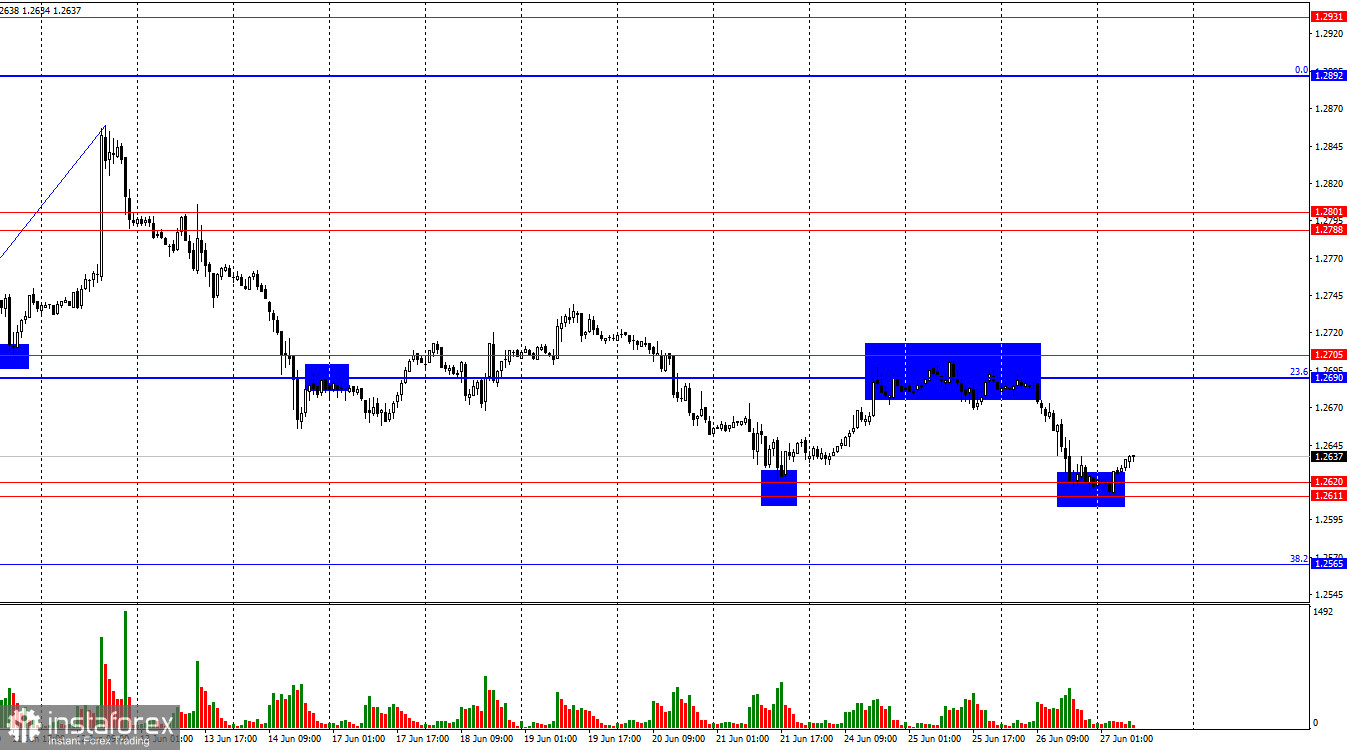
On the hourly chart, the GBP/USD pair rebounded from the resistance zone of 1.2690–1.2705, turned in favor of the US dollar, and fell to the support zone of 1.2611–1.2620. A rebound of quotes from this zone will favor the British pound and a reverse growth towards 1.2690–1.2705. Closing the pair below 1.2611–1.2620 will suggest a further decline of the pound towards the 38.2% Fibonacci level at 1.2565.

The wave situation has changed slightly. The last upward wave broke the peak from June 4, while the new downward wave (still forming) broke the low from June 10. Thus, the trend for the GBP/USD pair has shifted to "bearish." I cautiously conclude the start of a "bearish" trend since the bulls have not entirely left the market. The emerging advantage of the bears could be reversed. However, at this time, the 1.2690–1.2705 zone once again shows us that the bears have slightly better prospects than the bulls.
The information background was absent again on Wednesday. The bulls failed to conquer the 1.2690–1.2705 zone, but they only made local retreats and seemed to be waiting for the right moment to launch an offensive. Today, traders will closely watch the US GDP report and tomorrow - the UK GDP report. There are all reasons to expect a stronger GDP figure in the UK and a weaker one in the US. Thus, in the best case for the dollar, the final estimates will match market expectations, which will not provoke a strong reaction. Then, the GBP/USD pair will trade between significant zones and levels. A breakthrough of any of these will mean the pair moves into a new trading range.

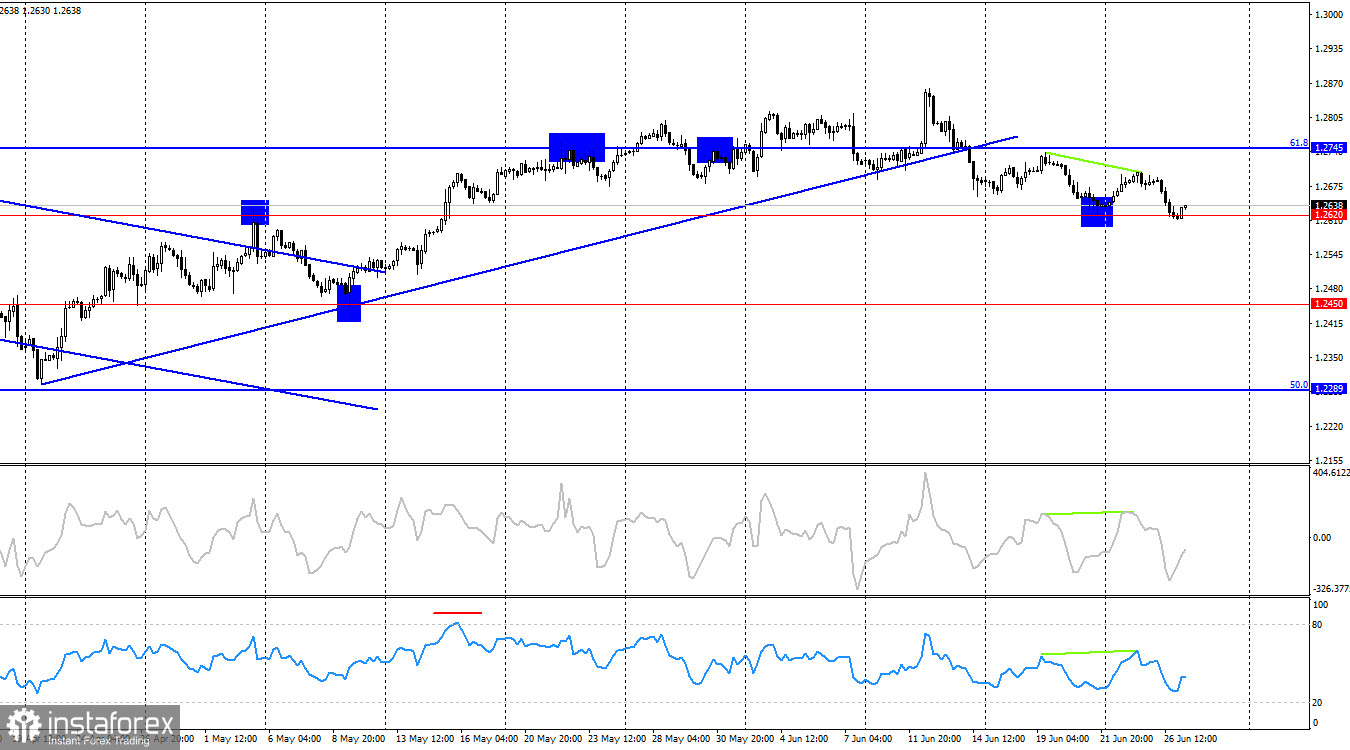
On the 4-hour chart, the pair reversed in favor of the US dollar and consolidated below the ascending trendline. After rebounding from the 1.2620 level, the pound grew slightly. However, the "bearish" divergence in the CCI and RSI indicators suggests a potential reversal in favor of the US dollar and a resumption of the decline. Consolidating the pair below this level will increase the likelihood of further decline towards the next level at 1.2450.
Commitments of Traders (COT) Report:

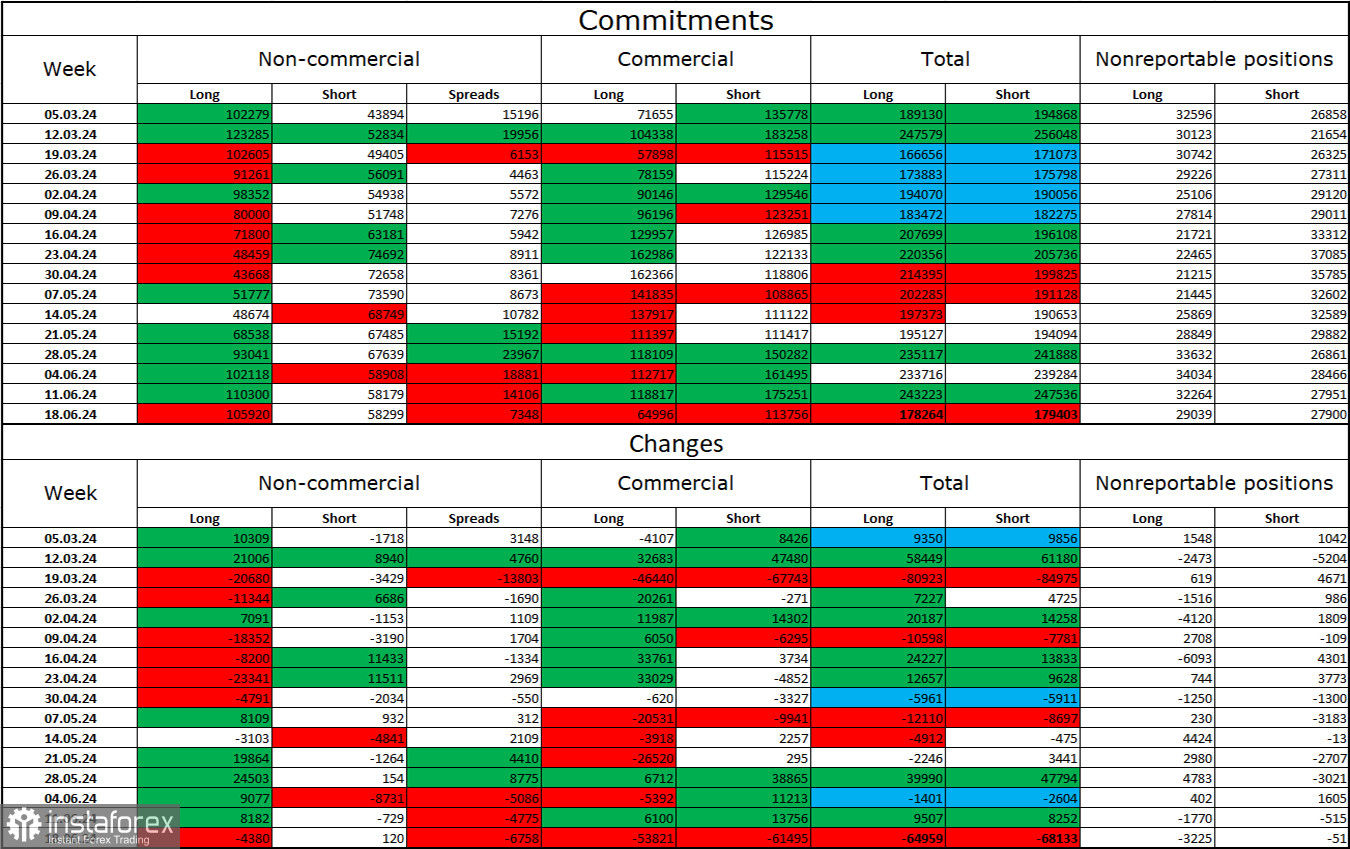
The sentiment of the "Non-commercial" category of traders became slightly less "bullish" during the last reporting week. The number of long positions held by speculators decreased by 4,380 units, while the number of short positions increased by 120. Bulls still hold a solid advantage. The gap between the long and short positions is 48 thousand: 106 thousand versus 58 thousand.
However, the British pound still has excellent prospects for a decline. The graphical analysis has issued several signals indicating a breakdown of the "bullish" trend, and the bulls cannot attack indefinitely. Over the past three months, the number of long positions has increased from 102 thousand to 106 thousand, while the number of short positions has grown from 44 thousand to 58 thousand. Over time, large players will continue to reduce buy positions or increase sell positions, as all possible factors for buying the British pound have already been priced in.
News Calendar for the US and UK:
US – Change in Durable Goods Orders (12:30 UTC)
US – GDP Change in the First Quarter (12:30 UTC)
US – Initial Jobless Claims (12:30 UTC)
On Thursday, the economic events calendar includes several important entries. The impact of the news background on market sentiment today may be moderate in strength during the second half of the day.
Forecast for GBP/USD and Trading Tips:
Selling the pound was possible yesterday after a rebound from the 1.2690–1.2705 zone with a target of 1.2611–1.2620. This target has been reached. Buying can be considered after a rebound from the 1.2611–1.2620 zone on the hourly chart with a target of 1.2690–1.2705. New sales are possible with a close below 1.2611–1.2620 target of 1.2565. Fibonacci levels are drawn from 1.2036–1.2892 on the hourly chart and from 1.4248–1.0404 on the 4-hour chart.


