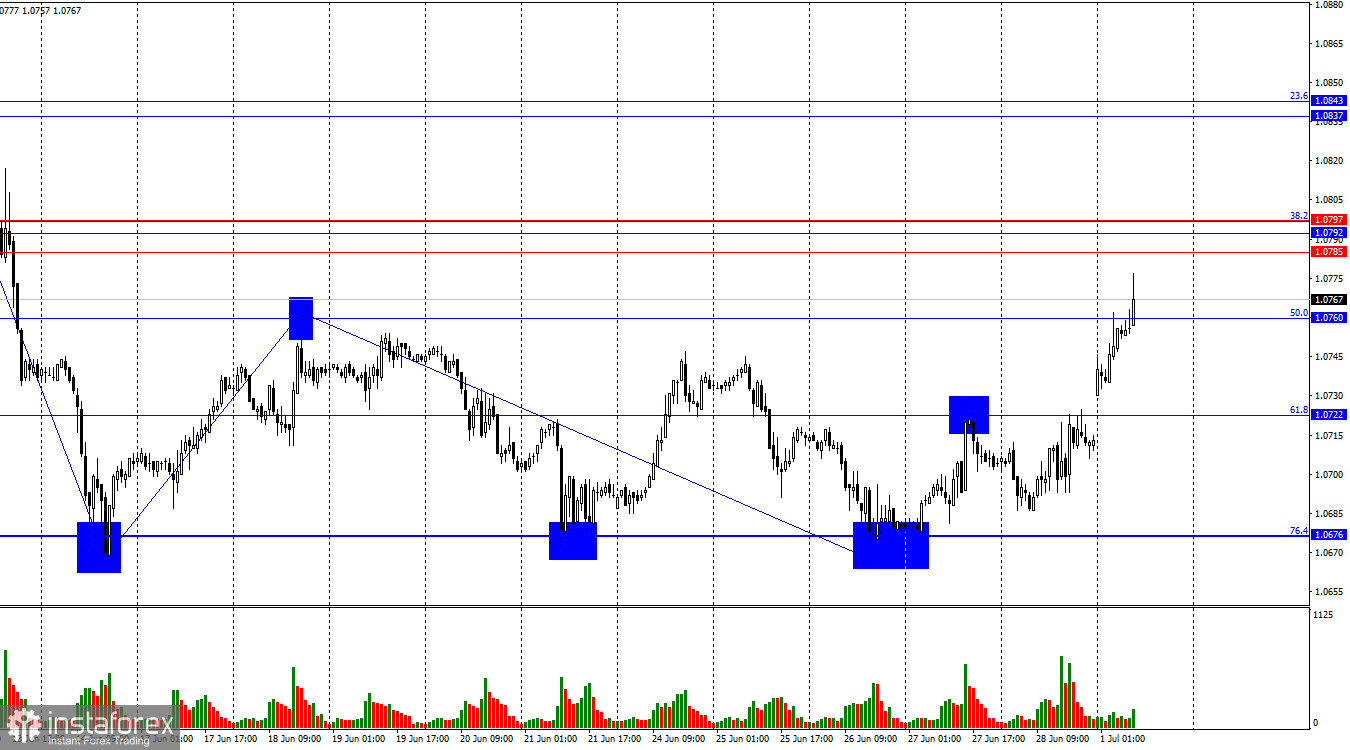
On Friday, the EUR/USD pair returned to the corrective level of 61.8% (1.0722). However, as of Monday morning, the pair consolidated above this level and continued to rise towards the 50.0% Fibonacci level at 1.0760. A rebound from this level or the resistance zone at 1.0785–1.0797 will favor the US dollar and lead to a new decline towards the corrective level of 76.4% (1.0676). At the moment, I see no reasons for a significant rise in the euro. It's possible that what we saw today is a bull trap.

The wave situation became confusing this morning. The new upward wave broke the peak of the previous wave, but at the same time, there were no informational reasons for such growth. The last completed downward wave failed to break the low of the previous wave, which can be considered a sign of a trend change from "bearish" to "bullish." We already have two such signs, but today, it opened with an upward gap and rose by 60 points during the night and morning.
The information background on Friday was quite dull and uninteresting. This morning, traders' actions forced us to shift our focus to this week and forget about the previous one. Important events will occur throughout this week in both the Eurozone and the US, but the week has only just begun; no reports have been released yet, and the bulls have already started attacking. I think this might be a move aimed at liquidating the bears' Stop Losses. One way or another, I still don't see any strong reasons for the growth of the euro, but they may appear this week. Reports on business activity will be released today in the US, among which I must highlight the ISM index in the US and Christine Lagarde's speech. By the way, gaps often close, so we will see a similarly strong decline in the pair today or tomorrow.

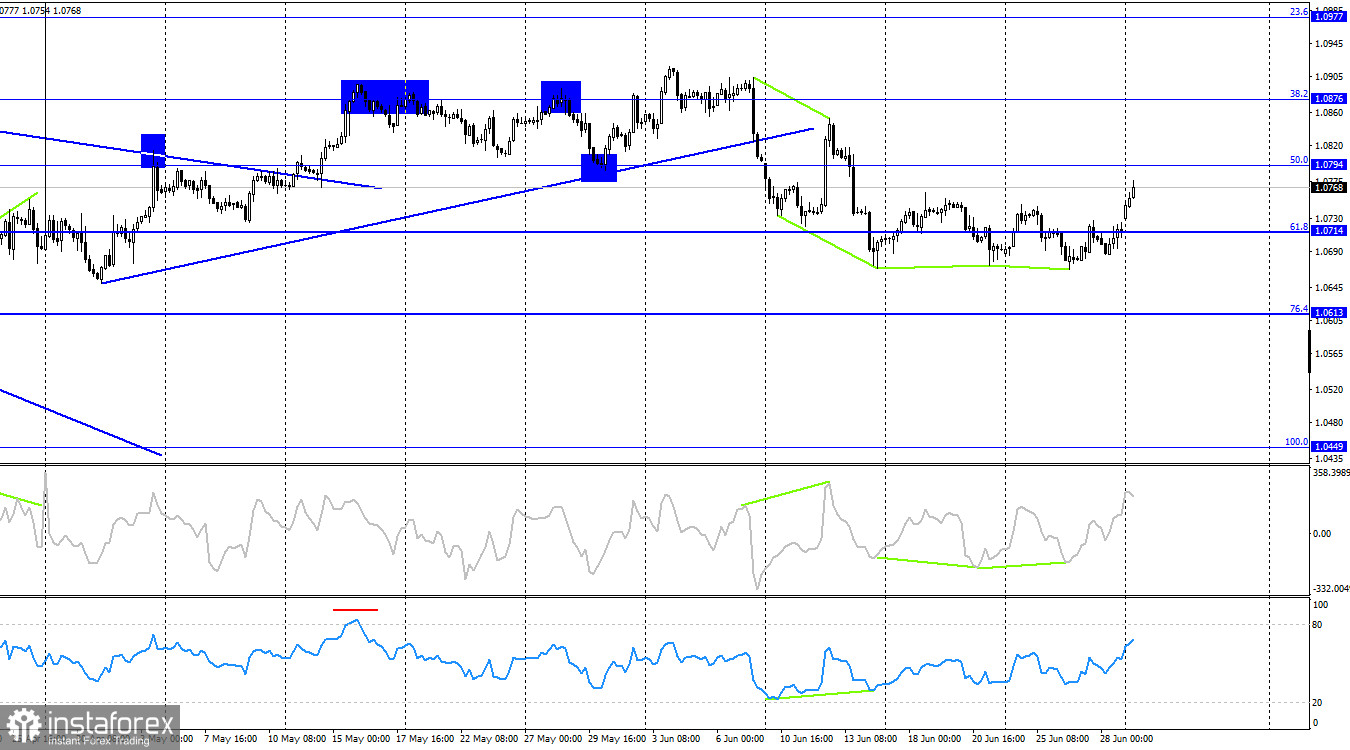
On the 4-hour chart, the pair reversed in favor of the euro after forming a new "bullish" divergence with the CCI indicator. A week ago, the 4-hour chart showed a close below the trend line, which shifted traders' sentiment to "bearish." Thus, any "bullish" divergences (in my opinion) signal a correction. However, the hourly chart shows signs of a trend change to "bullish." Moreover, this week, the information background may support the bulls.
Commitments of Traders (COT) report:

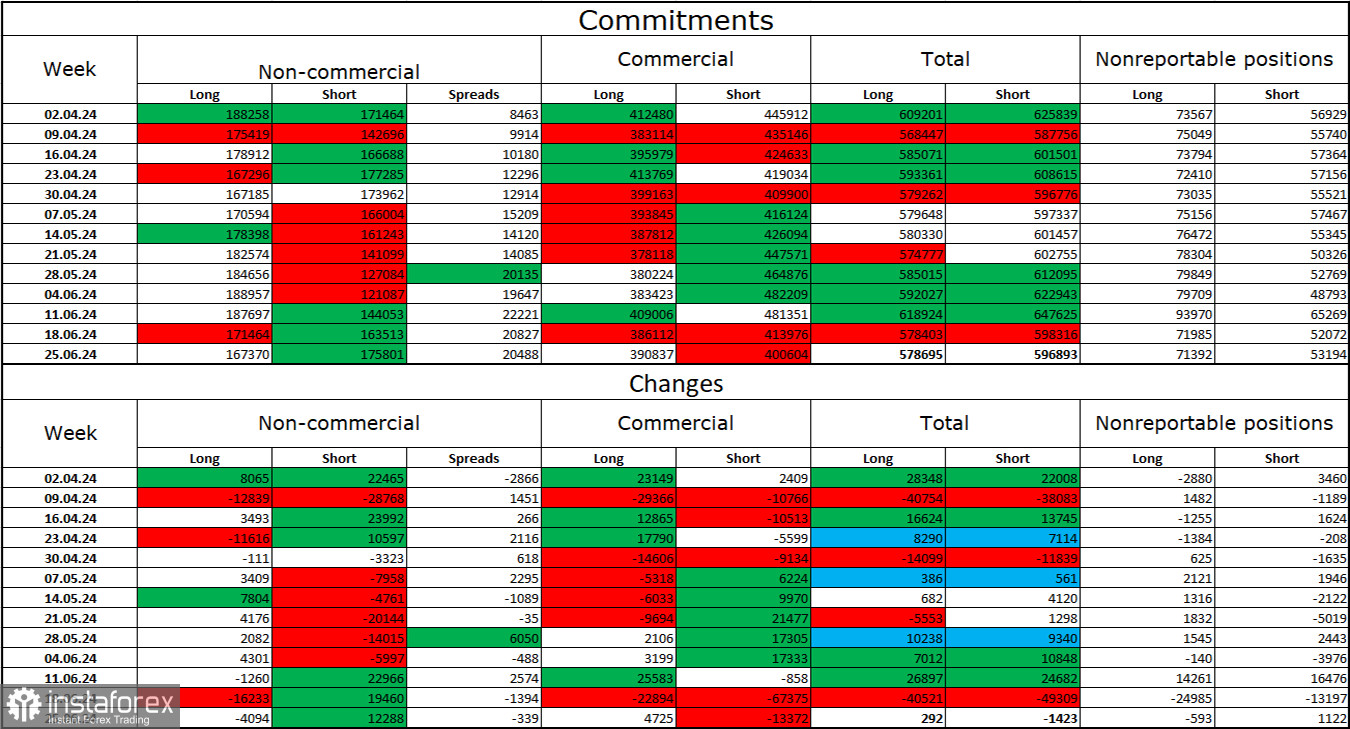
During the last reporting week, speculators closed 4,094 long positions and opened 12,288 short positions. The sentiment of the "Non-commercial" group turned "bearish" a few weeks ago and is currently intensifying. The total number of long positions held by speculators now stands at 167,000, while the number of short positions is 175,000.
The situation will continue to shift in favor of the bears. I don't see any long-term reasons to buy the euro, as the ECB has started easing its monetary policy, which will lower the yields on bank deposits and government bonds. These yields will remain high in the US for at least a few months, making the dollar more attractive to investors. The potential for a decline in the euro is significant, even according to COT reports. Currently, the number of short positions among professional players is increasing.
News Calendar for the USA and Eurozone:
Eurozone:
- German Manufacturing PMI (07:55 UTC)
- Eurozone Manufacturing PMI (08:00 UTC)
- German Consumer Price Index (12:00 UTC)
USA:
- Manufacturing PMI (13:45 UTC)
- ISM Manufacturing PMI (14:00 UTC)
Eurozone:
- ECB President Christine Lagarde's Speech (19:00 UTC)
On July 1, the economic events calendar contains many important entries. The influence of the information background on trader sentiment today may be strong throughout the day.
EUR/USD Forecast and Trading Tips:
New sales of the pair are possible if it consolidates on the hourly chart below the level of 1.0760, with targets at 1.0722 and 1.0676, or in the event of a rebound from the zone of 1.0785 - 1.0797 with the same targets. Buying the euro was possible upon a rebound on the hourly chart from the level of 1.0676 with a target of 1.0722, which has been achieved. I don't see any grounds for new purchases, but they may appear during the week.
Fibonacci levels grids are built from 1.0602 to 1.0917 on the hourly chart and from 1.0450 to 1.1139 on the 4-hour chart.


