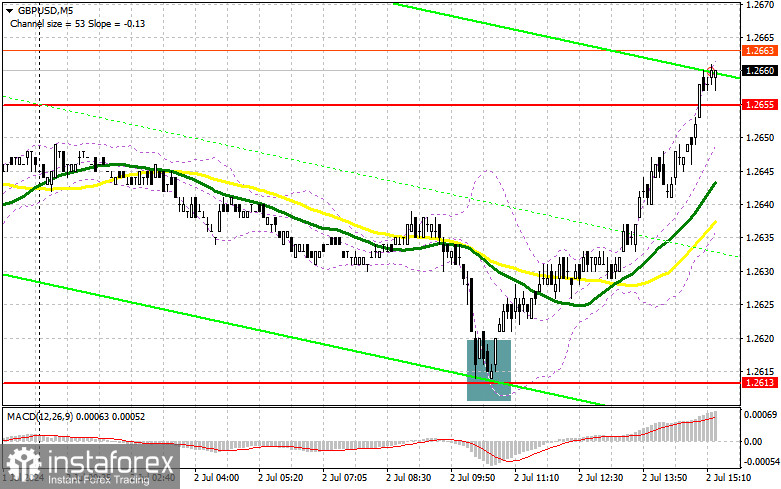
In my morning forecast, I focused on the 1.2613 level and planned to make market entry decisions based on it. Let's look at the 5-minute chart and see what happened there. The decline and formation of a false breakout provided an excellent entry point for buying, resulting in the pair rising by more than 45 points. The technical picture was not revised for the second half of the day.

To open long positions on GBP/USD, the following is required:
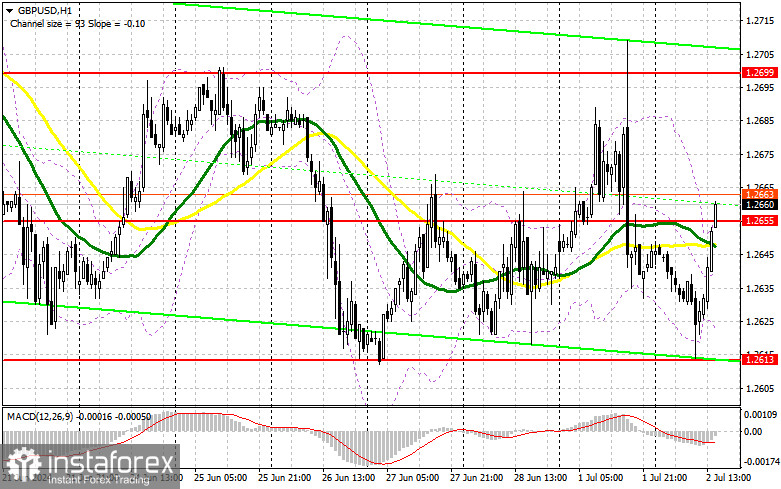
The absence of statistics and active buying near the monthly low gave reason to believe in the potential recovery of the pound in the second half of the day. However, this will depend on a disappointing report on job openings and labor turnover from the U.S. Bureau of Labor Statistics. Additionally, the speech of Federal Reserve Chairman Jerome Powell is awaited. Only his dovish stance will help the pound. In case of a decline in the pair, active defense of the morning support at 1.2613 with a false breakout will provide a good entry point for long positions with the prospect of returning to and updating the resistance at 1.2655. A breakout and retest from top to bottom of this range will restore the pound's upward potential, leading to an entry point for long positions with the possibility of updating the upper boundary of the sideways channel at 1.2699. The furthest target will be the area of 1.2732, where I plan to take profit.
In the scenario of a decline in GBP/USD and a lack of bullish activity at 1.2613 in the second half of the day, and considering this level has been tested three times recently, the pressure on the pair will return. This will also lead to a decline and a retest of the next support at 1.2583, increasing the chances of developing a bearish market. Therefore, only a false breakout will be suitable for opening long positions. I plan to buy GBP/USD immediately on a rebound from the 1.2550 low with the target of a 30-35 point intraday correction.
To open short positions on GBP/USD, the following is required:
Sellers achieved everything they wanted but failed to disrupt market equilibrium, fully handing the initiative to buyers. In the second half of the day, the entire focus will be on regaining control of 1.2655. Therefore, only a false breakout formation will be a suitable option for opening short positions to reduce and test the channel's lower boundary at 1.2613 again. A breakout and retest from the bottom to the top of this range, along with strong U.S. statistics, will hit the buyers' positions, triggering stop orders and opening the path to 1.2583 – a new low for this month. The furthest target will be the area of 1.2550, where I will take profit. Testing this level will strengthen the bearish market.
In the scenario of GBP/USD rising and the absence of bearish activity at 1.2655 in the second half of the day, buyers will attempt to get a chance for an upward correction. In this case, I will delay sales until a false breakout at the 1.2699 level. If there is no downward movement, I will sell GBP/USD immediately on a rebound from 1.2732, but only targeting a downward correction of the pair by 30-35 points intraday.


Indicator Signals:
Moving Averages
Trading occurs around the 30 and 50-day moving averages, indicating a sideways market trend.
Note: The author considers the period and prices of moving averages on the H1 hourly chart and differs from the general definition of classic daily moving averages on the D1 daily chart.
Bollinger Bands
In case of a decline, the lower boundary of the indicator, around 1.2625, will act as support.
Description of Indicators:
- Moving Average (determines the current trend by smoothing volatility and noise). Period: 50. Marked in yellow on the chart.
- Moving Average (determines the current trend by smoothing volatility and noise). Period: 30. Marked in green on the chart.
- MACD Indicator (Moving Average Convergence/Divergence – convergence/divergence of moving averages). Fast EMA period: 12. Slow EMA period: 26. SMA period: 9.
- Bollinger Bands. Period: 20.
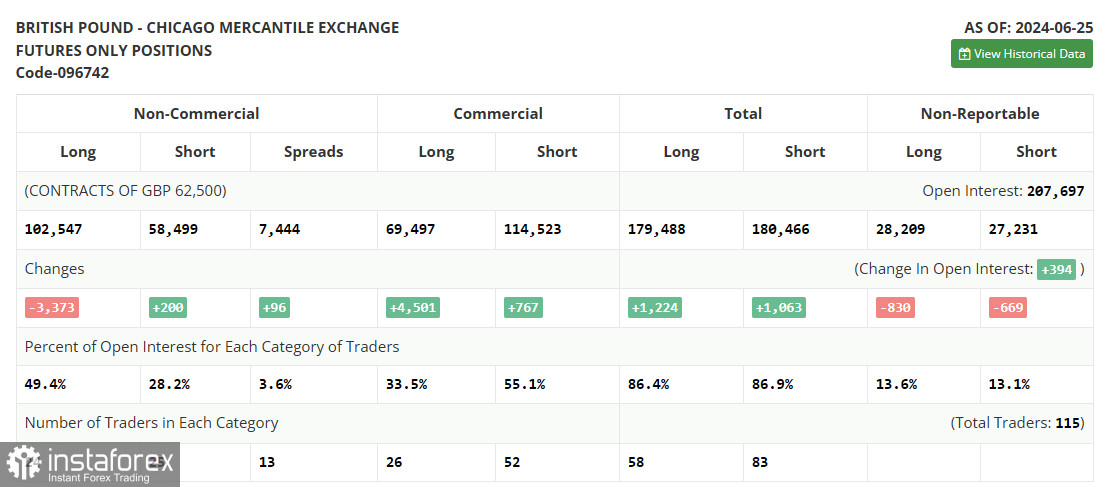
- Non-commercial traders – speculators such as individual traders, hedge funds, and large institutions using the futures market for speculative purposes and meeting certain requirements.
- Long non-commercial positions represent the total long open position of non-commercial traders.
- Short non-commercial positions represent the total short open positions of non-commercial traders.
- Total non-commercial net position is the difference between short and long positions of non-commercial traders.


