Analysis of GBP/USD 5M

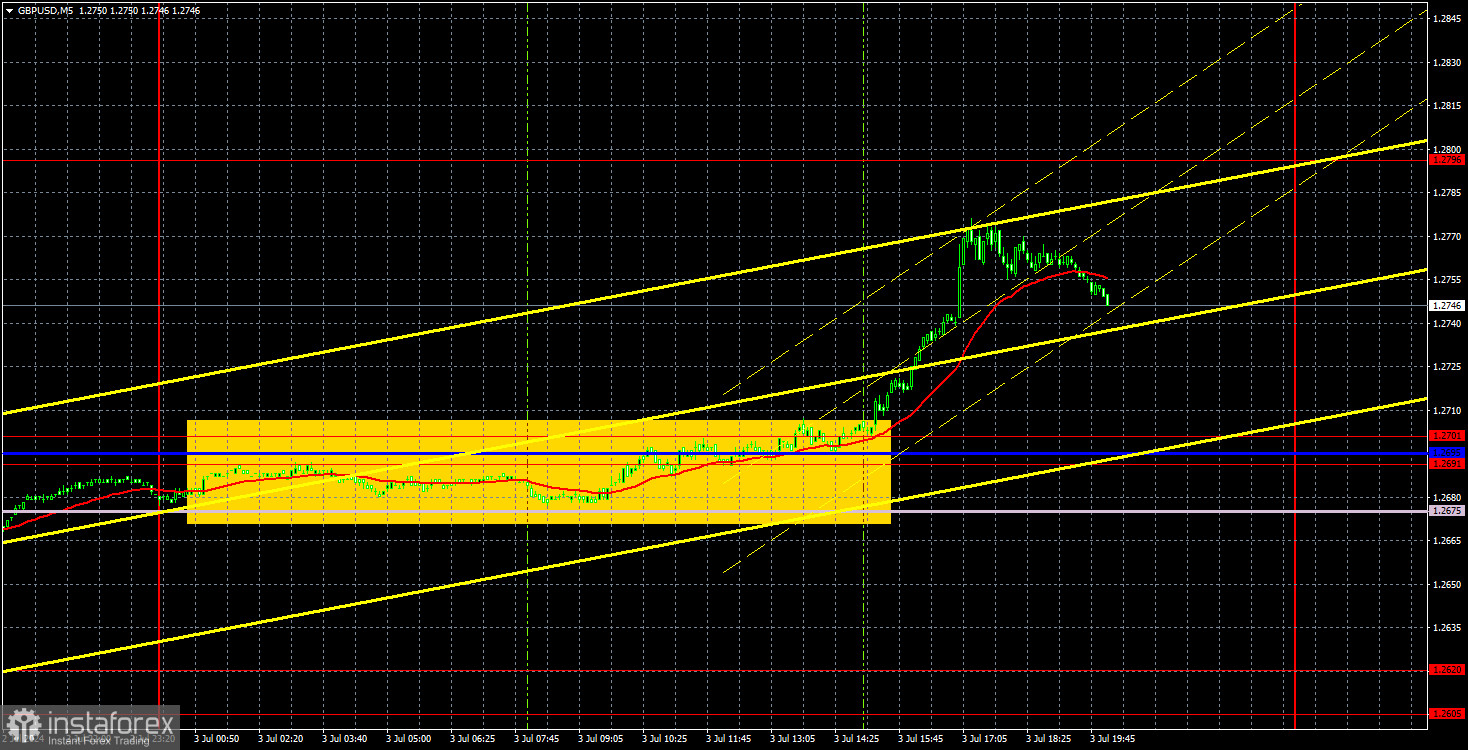
Yesterday, GBP/USD traded mostly in a flat range between the levels of 1.2605 and 1.2701. However, the ISM Services PMI was published during the US trading session, which not only came in below expectations but also fell below the "waterline" of 50.0. In addition, the ADP employment report for the private sector also fell short of market expectations. These reports ultimately triggered the dollar's decline.
To be fair, the dollar had more reasons to fall than rise this week. The ISM PMI data was disappointing. The ADP report came in worse than expected. The JOLTs report exceeded expectations, but the market ignored this. Just like how it ignored Federal Reserve Chair Jerome Powell's hawkish stance this week, when he made it clear that the central bank is in no hurry to lower rates. In fact, the market has long ceased to pay attention to Powell's rhetoric. It simply does not care that the Fed may keep the rate at its peak level until the end of the year, even though at the beginning of the year the market expected monetary easing in March and was actively trading based on this factor. Yes, this week the GBP/USD pair deserved to rise, but overall, it continues to show erratic and illogical movements. It will be interesting to see what happens when the Bank of England starts lowering rates.
The pair formed one trading signal on the 5-minute timeframe. At the beginning of the US session, the price consolidated above the area of 1.2691-1.2701, so traders could open long positions. The price did not reach the target level of 1.2796, but the trade could be closed manually closer to the evening. The profit from this trade was about 50 pips.
COT report:

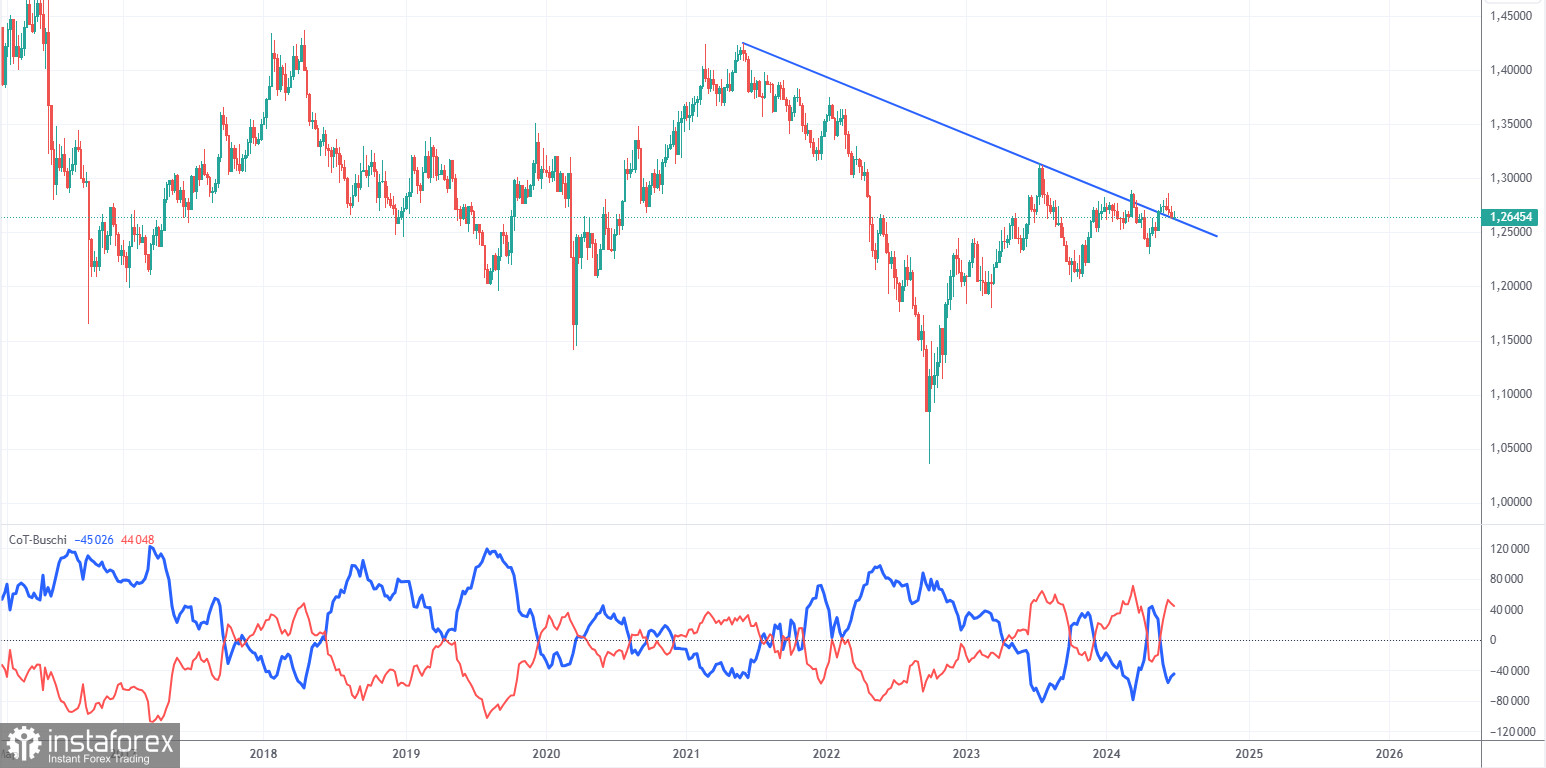
COT reports on the British pound show that the sentiment of commercial traders has frequently changed in recent years. The red and blue lines, which represent the net positions of commercial and non-commercial traders, constantly intersect and mostly remain close to the zero mark. According to the latest report on the British pound, the non-commercial group closed 3,400 buy contracts and opened 200 short ones. As a result, the net position of non-commercial traders decreased by 3,600 contracts over the week. Thus, sellers failed to seize the initiative.
The fundamental background still does not provide a basis for long-term purchases of the pound sterling, and the currency has a good chance to resume the global downward trend. However, the price has already breached the trend line on the 24-hour timeframe at least twice. The level of 1.2800 (which is the upper boundary of the sideways channel) is currently preventing the pound from rising further.
The non-commercial group currently has a total of 102,400 buy contracts and 58,500 sell contracts. The bulls are taking the lead in the market, but aside from the COT reports, nothing else suggests a potential rise in the GBP/USD pair. Such a strong advantage suggests that the pair may fall...
Analysis of GBP/USD 1H

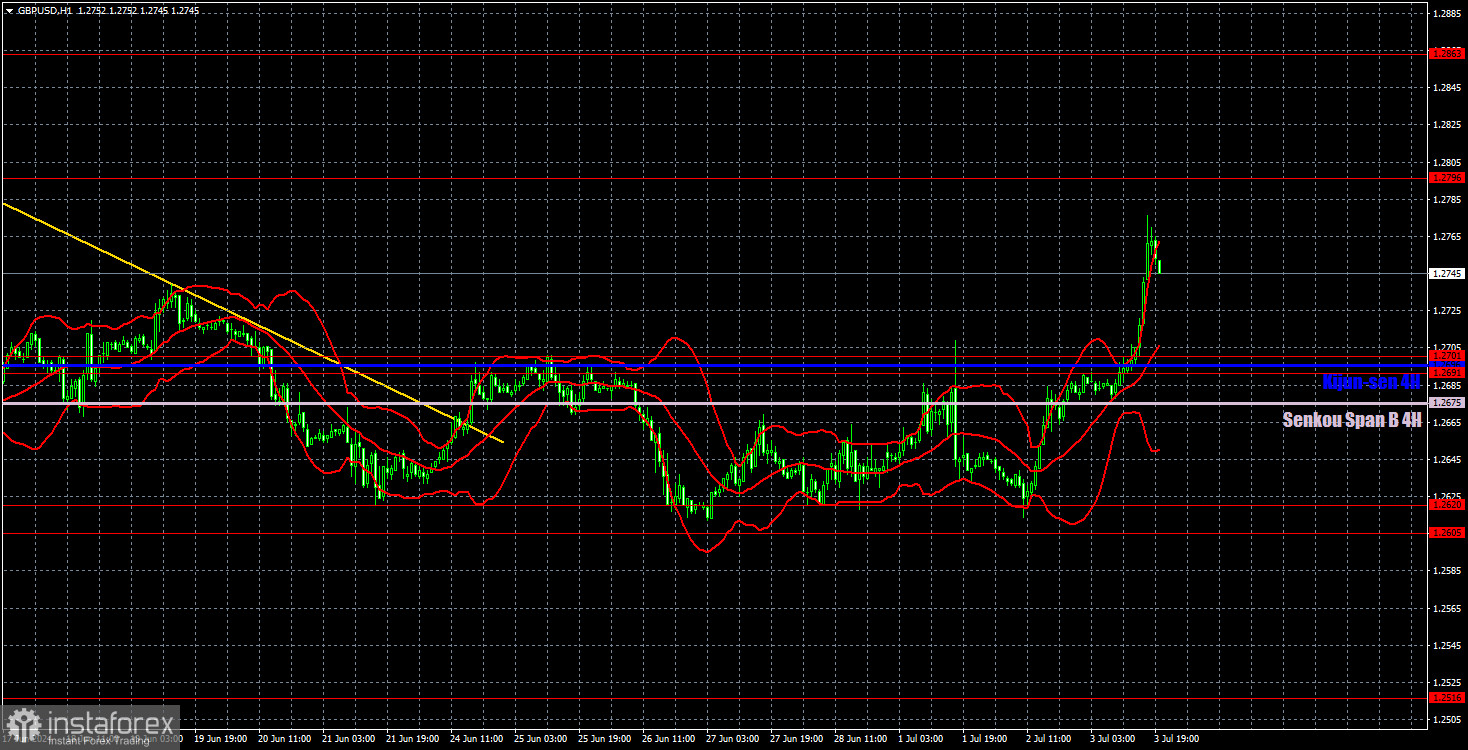
On the 1H chart, GBP/USD has yet to overcome the 1.2605-1.2620 area. A new bounce from this area triggered another round of the corrective movement, and a bounce from the 1.2691-1.2701 area sparked a new wave of decline. We expect the pound to fall in the medium-term, but it is quite naive to expect that a pair, which has shown unreasonable growth for more than six months, will suddenly start falling every day. The pound shows erratic movements, and we wouldn't be surprised if in the next few days the price returns to the 1.2605-1.2620 area.
As of July 4, we highlight the following important levels: 1.2215, 1.2269, 1.2349, 1.2429-1.2445, 1.2516, 1.2605-1.2620, 1.2691-1.2701, 1.2796, 1.2863, 1.2981-1.2987. The Senkou Span B line (1.2675) and Kijun-sen (1.2696) lines can also serve as sources of signals. Don't forget to set a Stop Loss to breakeven if the price has moved in the intended direction by 20 pips. The Ichimoku indicator lines may move during the day, so this should be taken into account when determining trading signals.
On Thursday, no important reports are scheduled in the UK and the US. Today is a holiday in America in honor of Independence Day. All trading platforms, banks, and exchanges will be closed. In the UK, the second estimate of the Construction PMI data will be published, but this is of secondary importance.
Description of the chart:
Support and resistance levels are thick red lines near which the trend may end. They do not provide trading signals;
The Kijun-sen and Senkou Span B lines are the lines of the Ichimoku indicator, plotted to the 1H timeframe from the 4H one. They provide trading signals;
Extreme levels are thin red lines from which the price bounced earlier. They provide trading signals;
Yellow lines are trend lines, trend channels, and any other technical patterns;
Indicator 1 on the COT charts is the net position size for each category of traders;


