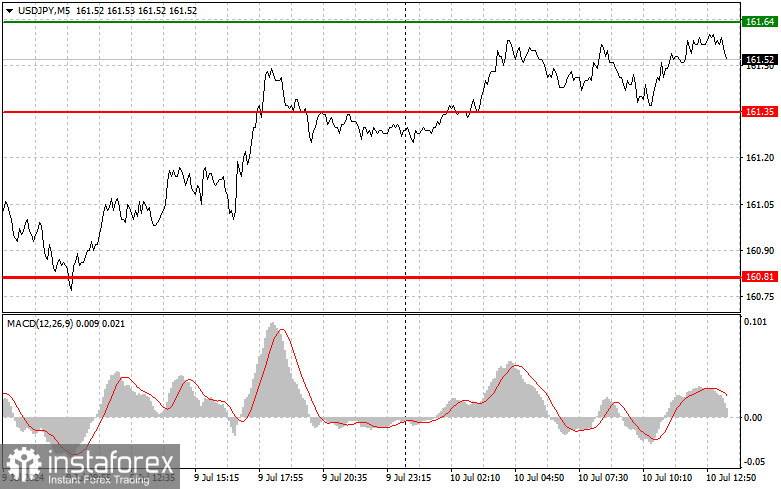
Analysis of Trades and Tips for Trading the Japanese YenDue to the low market volatility and the pair being near its annual maximum, which in itself deters active dollar buyers, the levels I had indicated were not tested. Consequently, no suitable entry conditions were met. It's okay if the second half of the day unfolds just like the first. Despite the planned speech by Fed Chairman Jerome Powell, his remarks will be identical to those we heard yesterday, so we won't learn anything new. Data on changes in wholesale inventories in the US and the speech by FOMC member Michelle Bowman are unlikely to change the situation. Regarding the intraday strategy, I plan to act based on the realization of Scenarios #1 and #2.

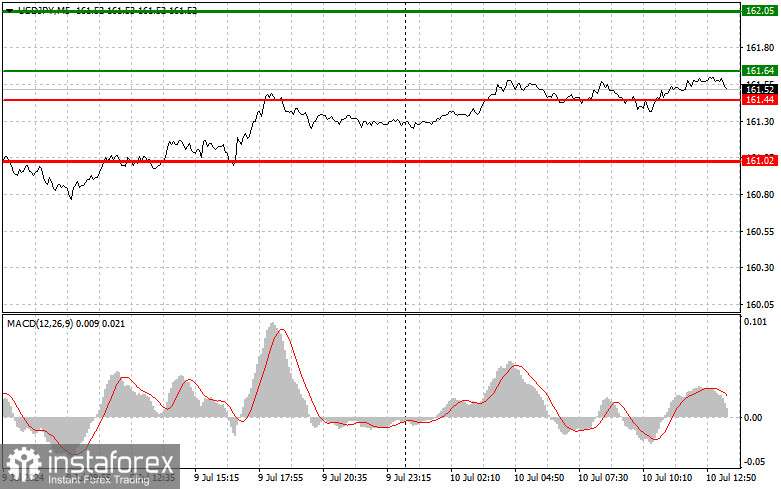
Buy SignalScenario #1: Today, I plan to buy USD/JPY at the entry point around 161.64 (green line on the chart) with the target of rising to the 162.05 level (thicker green line). Around 161.05, I will exit purchases and open sales in the opposite direction (expecting a movement of 30-35 points in the opposite direction from the level). The pair's growth today can only be expected after breaking the weekly high. Important: Before buying, ensure the MACD indicator is above the zero mark and starting to rise from it.Scenario #2: I also plan to buy USD/JPY today in case of two consecutive tests of the price of 161.44, at a time when the MACD indicator is in the oversold area. This will limit the pair's downward potential and lead to a market reversal upwards. We can expect an increase to the opposite levels of 161.64 and 162.05.Sell signalScenario No. 1: I plan to sell USD/JPY today after updating the level of 161.44 (the red line on the chart), which will lead to a rapid decline in the pair. The key target of sellers will be the 161.02 level, where I will exit sales, as well as immediately open purchases in the opposite direction (counting on a movement of 20-25 points in the opposite direction from the level). Pressure on the pair will return in case of an unsuccessful attempt to rise above the daily high. Important: Before selling, ensure the MACD indicator is below the zero mark and starting to decline from it.Scenario #2: I also plan to sell USD/JPY today in case of two consecutive tests of the price of 161.64, at a time when the MACD indicator is in the overbought area. This will limit the pair's upward potential and lead to a downward market reversal. A decline can be expected to the opposite levels of 161.44 and 161.02.

Chart Details:
- Thin Green Line: Entry price for buying the trading instrument.
- Thick Green Line: Expected price where you can place Take Profit or manually fix profits, as further growth above this level is unlikely.
- Thin Red Line: Entry price for selling the trading instrument.
- Thick Red Line: Expected price where you can place Take Profit or manually fix profits, as further decline below this level is unlikely.
- MACD Indicator: When entering the market, it is important to consider overbought and oversold areas.
Important. Novice traders in the forex market need to make decisions about entering the market very carefully. Before the release of important fundamental reports, it is best to stay out of the market to avoid falling into sharp fluctuations in the exchange rate. If you decide to trade during the news release, always place stop orders to minimize losses. You must set stop orders to avoid losing your entire deposit, especially if you don't use money management and trade large volumes.Remember, to trade successfully, you need a clear trading plan, like the one presented above. Making spontaneous trading decisions based on the current market situation is initially a losing strategy for an intraday trader.


