Analysis of EUR/USD 5M

EUR/USD showed new upward movement on Thursday. This time, the market had substantial reasons for buying. Overall, the latest bullish momentum is entirely logical and justified, as it was driven by weak U.S. economic reports. The U.S. economy continues to slow down, business activity is declining, GDP growth rates are falling, the unemployment rate is rising, and inflation is gradually decreasing. However, since it is still decreasing, the market continues to anticipate a quick shift by the Federal Reserve towards a rate cut. In our opinion, the Fed can't lower rates even if inflation is at 3%. However, this no longer matters to the market. Is inflation falling? Then the Fed is getting closer and closer to its first rate cut. And it doesn't matter that the European Central Bank has already begun lowering rates and that the economic situation in the EU is much worse than in the U.S..
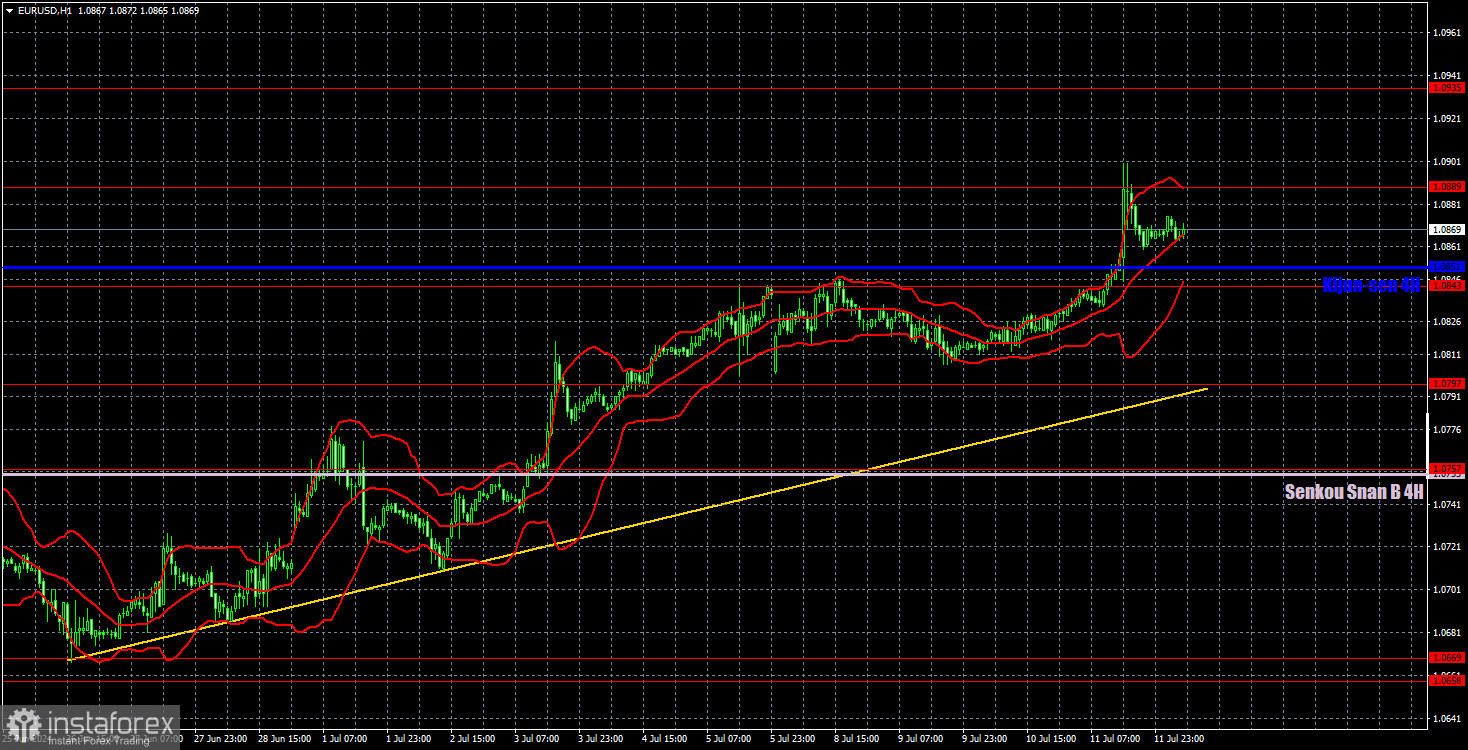
Hence, the current picture. The dollar's decline seems logical, but only when looking at U.S. macro data. Many other factors still suggest that the euro should fall, but the market ignores them. From a technical standpoint, we have a local upward trend supported by a trend line. Thus, until the price consolidates below it, we shouldn't expect a significant fall in the pair.
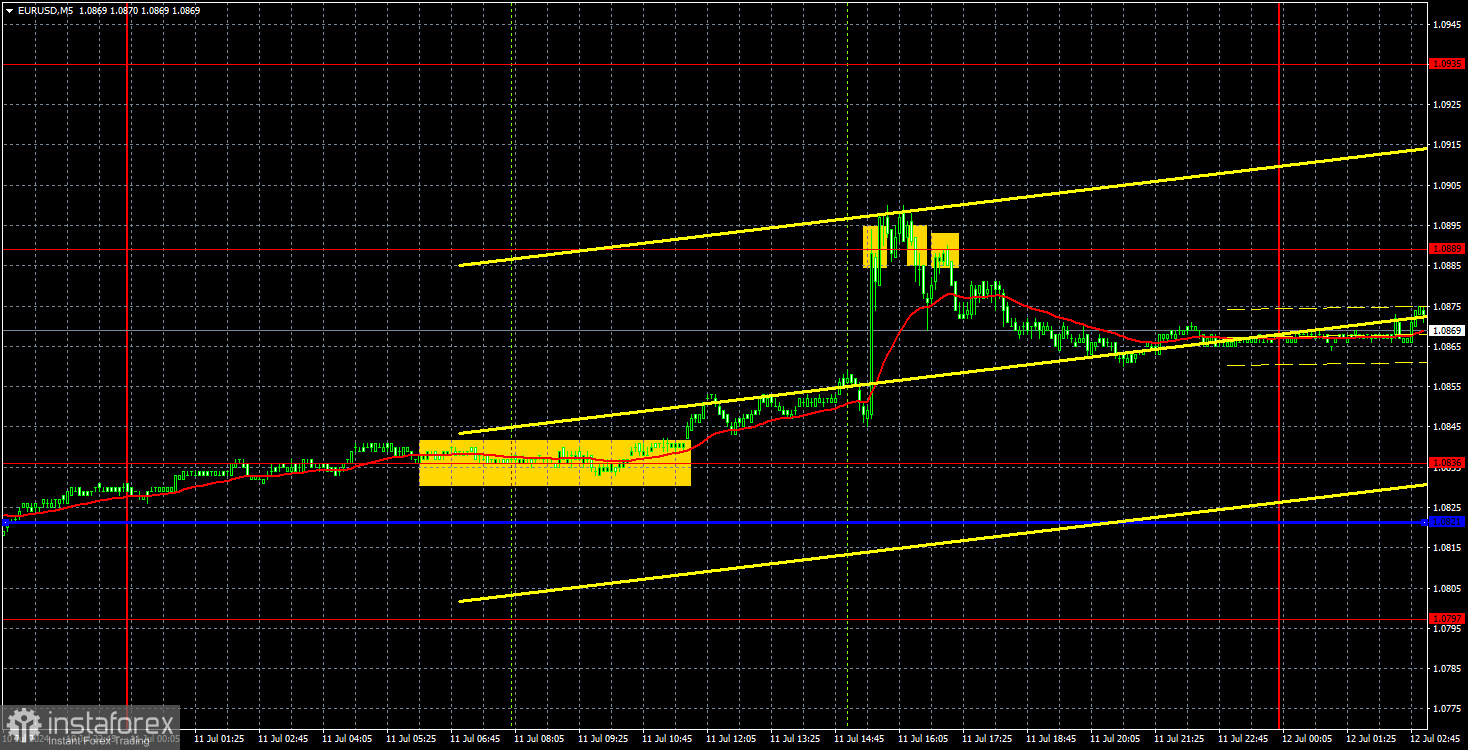
Yesterday, two trading signals were formed for the EUR/USD pair. First, the price bounced off the 1.0836 level and then it managed to rise to the 1.0889 level, thanks to the U.S. inflation report. Two sell signals were formed around this level, which could also have been executed. As a result, the first trade brought about 30 pips of profit, and the second - another 10 pips.
COT report:

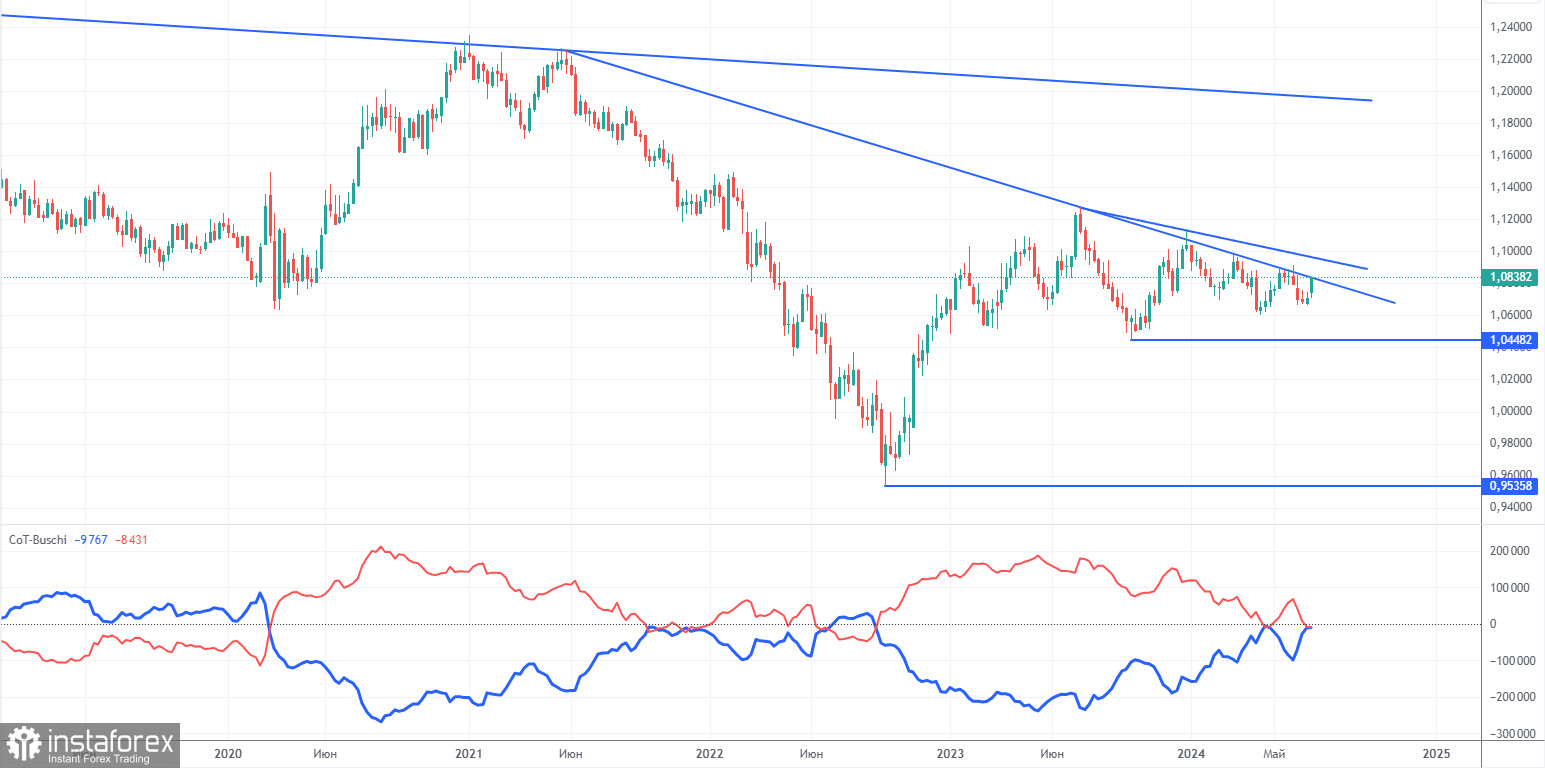
The latest COT report is dated June 25. The net position of non-commercial traders has remained bullish for a long time and remains so. The bears' attempt to gain dominance failed miserably. The net position of non-commercial traders (red line) has been declining in recent months, while that of commercial traders (blue line) has been growing. Currently, they are approximately equal, indicating the bears' new attempt to seize the initiative.
We don't see any fundamental factors that can support the euro's strength in the long term, while technical analysis also suggests a continuation of the downtrend. Three descending trend lines on the weekly chart suggests that there's a good chance of further decline. In any case, the downward trend is not broken.
Currently, the red and blue lines are approaching each other, which indicates a build-up in short positions on the euro. During the last reporting week, the number of long positions for the non-commercial group decreased by 4,100, while the number of short positions increased by 12,300. As a result, the net position decreased by 16,400. According to the COT reports, the euro still has significant potential for a decline.
Analysis of EUR/USD 1H

On the 1-hour chart, EUR/USD failed to break through the 1.0658-1.0669 area and continues to form a new uptrend. We currently have an ascending trend line, above which the upward trend remains intact. All the economic reports from the last two weeks have had a devastating impact on the dollar, so there's no sign of a decline yet. Meanwhile, the global downtrend remains on the 24-hour timeframe, which means that the pair could still fall back to the 1.06 level.
On July 12, we highlight the following levels for trading: 1.0530, 1.0581, 1.0658-1.0669, 1.0757, 1.0797, 1.0843, 1.0889, 1.0935, 1.1006, 1.1092, as well as the Senkou Span B (1.0755) and Kijun-sen (1.0851) lines. The Ichimoku indicator lines can move during the day, so this should be taken into account when identifying trading signals. Don't forget to set a Stop Loss to breakeven if the price has moved in the intended direction by 15 pips. This will protect you against potential losses if the signal turns out to be false.
No important events or reports scheduled in the Eurozone, while the U.S. docket will feature reports of medium importance: the Producer Price Index and the Consumer Sentiment Index from the University of Michigan. These reports could influence the pair's movement, but we don't expect the price to climb above Thursday's high. Strong U.S. data could trigger a natural correction.
Description of the chart:
Support and resistance levels are thick red lines near which the trend may end. They do not provide trading signals;
The Kijun-sen and Senkou Span B lines are the lines of the Ichimoku indicator, plotted to the 1H timeframe from the 4H one. They provide trading signals;
Extreme levels are thin red lines from which the price bounced earlier. They provide trading signals;
Yellow lines are trend lines, trend channels, and any other technical patterns;
Indicator 1 on the COT charts is the net position size for each category of traders;


