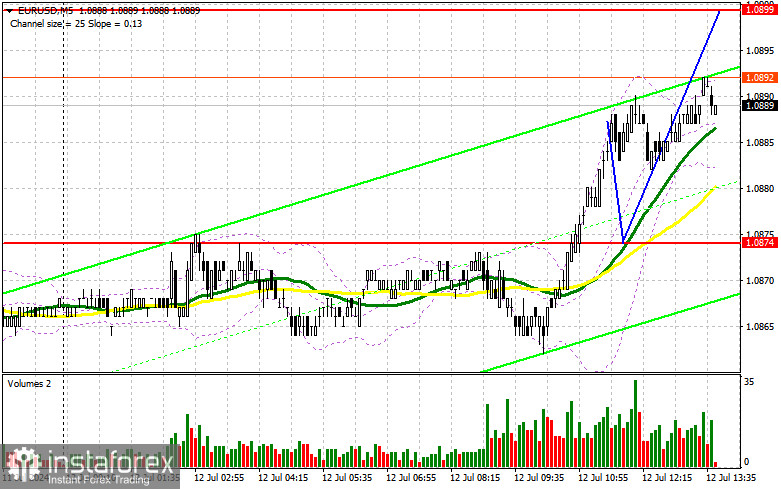
In my morning forecast, I highlighted the level of 1.0874 and planned to make trading decisions based on it. Let's look at the 5-minute chart and see what happened. The breakout occurred, but there was no reverse test of 1.0874, so I didn't get suitable entry points. The technical picture wasn't significantly revised for the second half of the day.

For opening long positions on EUR/USD:
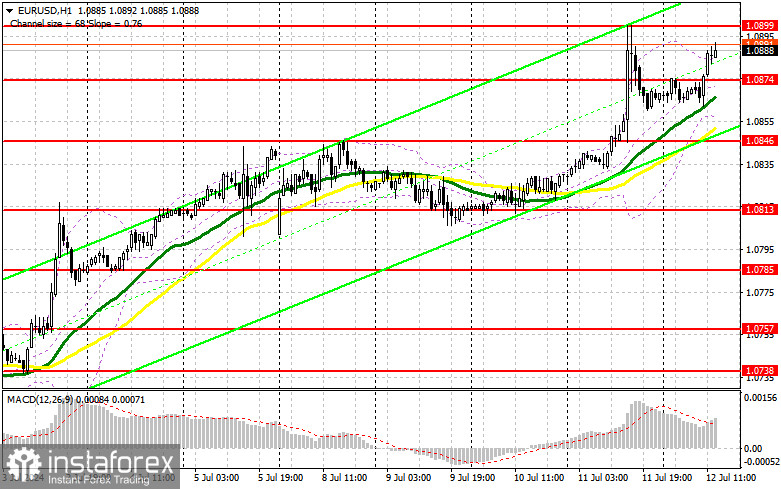
The most important event in the second half of the day will be the US Producer Price Index data. The trend of changes will be very important. If it follows the pattern of yesterday's overall Consumer Price Index, the euro will have a chance to continue its bullish trend and break through the monthly high. Otherwise, it could lead to profit-taking at the end of the week and a correction in the pair, especially if the Michigan Consumer Sentiment Index and inflation expectations data aren't particularly positive. In case of a decline, I plan to act around the nearest support at 1.0874, formed in the first half of the day. This will be a suitable entry point for long positions aiming to restore the euro towards resistance at 1.0899, which couldn't be broken yesterday. A breakout and upward retest of this range, similar to what I discussed earlier, will strengthen the pair with a chance to rise towards resistance at 1.0921. The ultimate target will be a maximum of 1.0942, where I will take profit. Testing this level will allow the bullish trend to continue. In case of a decline in EUR/USD and a lack of activity around 1.0874 in the second half of the day, and just above this level are the moving averages supporting the bulls, I will enter only after a false breakout around the next support at 1.0846. I plan to open long positions immediately on a rebound from the minimum of 1.0813, targeting an upward correction of 30-35 points within the day.
For opening short positions on EUR/USD:
Sellers are currently following a defensive tactic, and the first sign of their presence is expected around 1.0899. Only a false breakout there will provide a suitable entry point for short positions aiming for a decline towards the support at 1.0874, where the moving averages slightly below are supporting the bulls. A breakout and consolidation below this range, along with a retest from the bottom-up, will return pressure on the euro and provide another point for selling towards the minimum of 1.0846, where I expect more active buying of the euro. The ultimate target will be the area of 1.0813, where I will take profit. In case of an upward movement in EUR/USD in the development of the bullish trend, and the absence of bears at 1.0899, which is quite possible, buyers will be able to achieve further growth of the pair. In this case, I will postpone sales until testing the next resistance at 1.0921. I will also sell there, but only after an unsuccessful consolidation. I plan to open short positions immediately on a rebound from 1.0942, targeting a downward correction of 30-35 points.


Indicator Signals:
Moving Averages
Trading is conducted above the 30 and 50-day moving averages, indicating further growth of the euro.
Note: The period and prices of the moving averages are considered by the author on the H1 hourly chart and differ from the general definition of classical daily moving averages on the D1 daily chart.
Bollinger Bands
In case of a decline, the lower boundary of the indicator around 1.0850 will act as support.
Indicator Descriptions:
- Moving average: Defines the current trend by smoothing volatility and noise. Period 50. Marked in yellow on the chart.
- Moving average: Defines the current trend by smoothing volatility and noise. Period 30. Marked in green on the chart.
- MACD indicator (Moving Average Convergence/Divergence): Fast EMA period 12. Slow EMA period 26. SMA period 9.
- Bollinger Bands: Period 20.
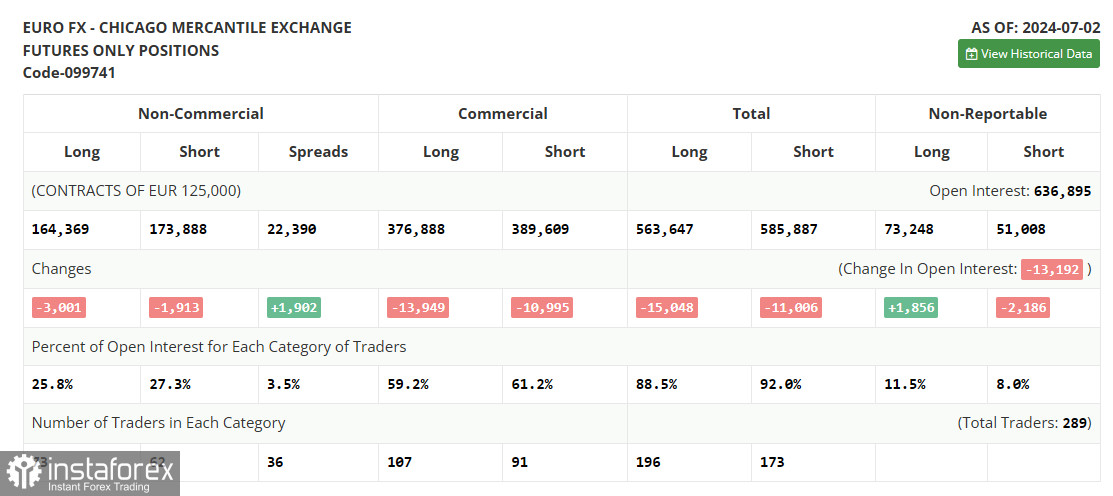
- Non-commercial traders: Speculators such as individual traders, hedge funds, and large institutions use the futures market for speculative purposes and meet certain requirements.
- Long non-commercial positions: The total long open positions of non-commercial traders.
- Short non-commercial positions: The total short open positions of non-commercial traders.
- Total non-commercial net position: The difference between short and long positions of non-commercial traders.


