Analysis of EUR/USD 5M

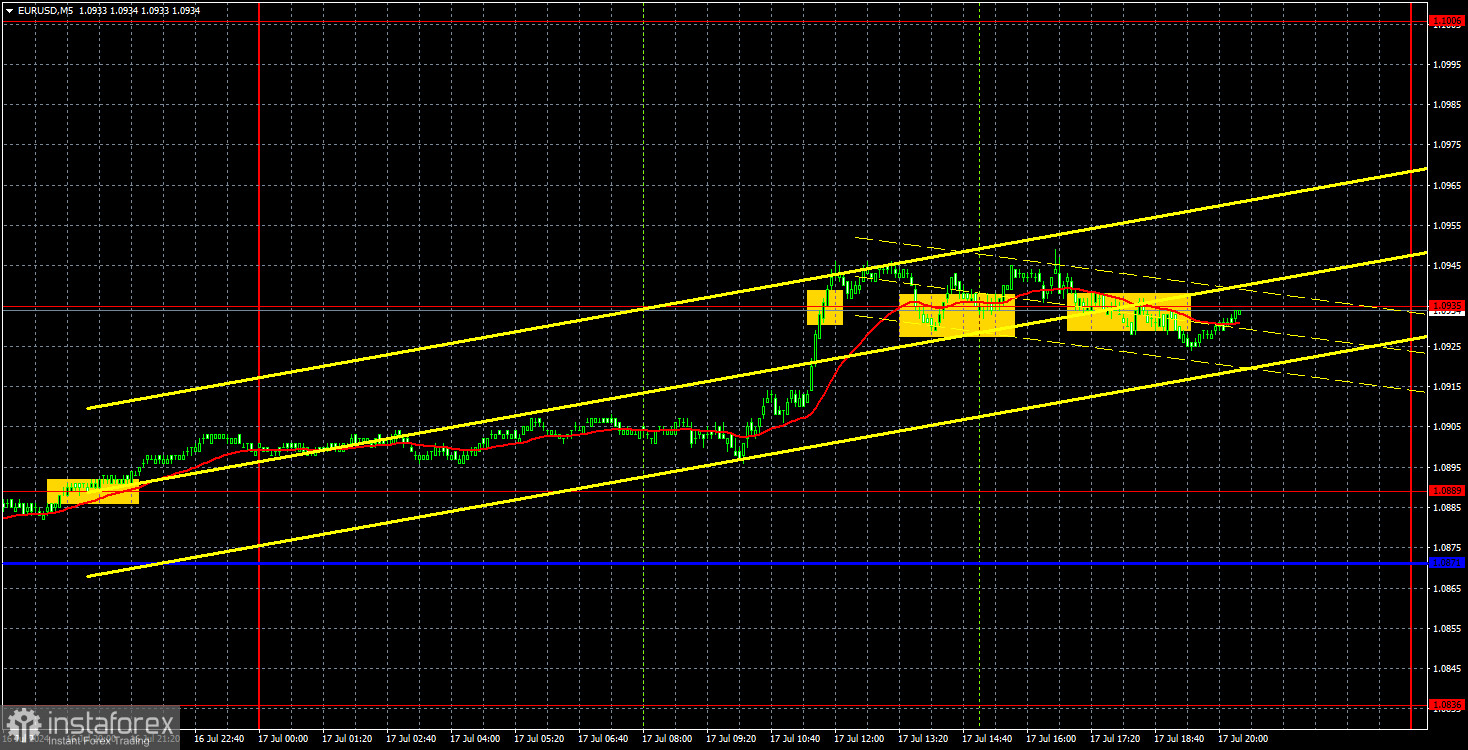
EUR/USD resumed its upward movement on Wednesday, failing to start a normal bearish correction. The euro had no grounds to rise on Wednesday, but, as we have repeatedly mentioned, this aspect is absolutely irrelevant for the market now. Yesterday, the second estimate of the EU Consumer Price Index for June was published, which was no different from the first one. Obviously, this report should not have provoked any market reaction at all. And if it did, the euro should not have risen again. Inflation in June slowed down to 2.5%. And the closer it is to 2%, the higher the probability that we will see two more rate cuts from the European Central Bank this year. Meanwhile, the Federal Reserve has not given any signals for a rate cut, but the market is still confident that it will happen soon. It is probably selling the U.S. dollar for this reason.
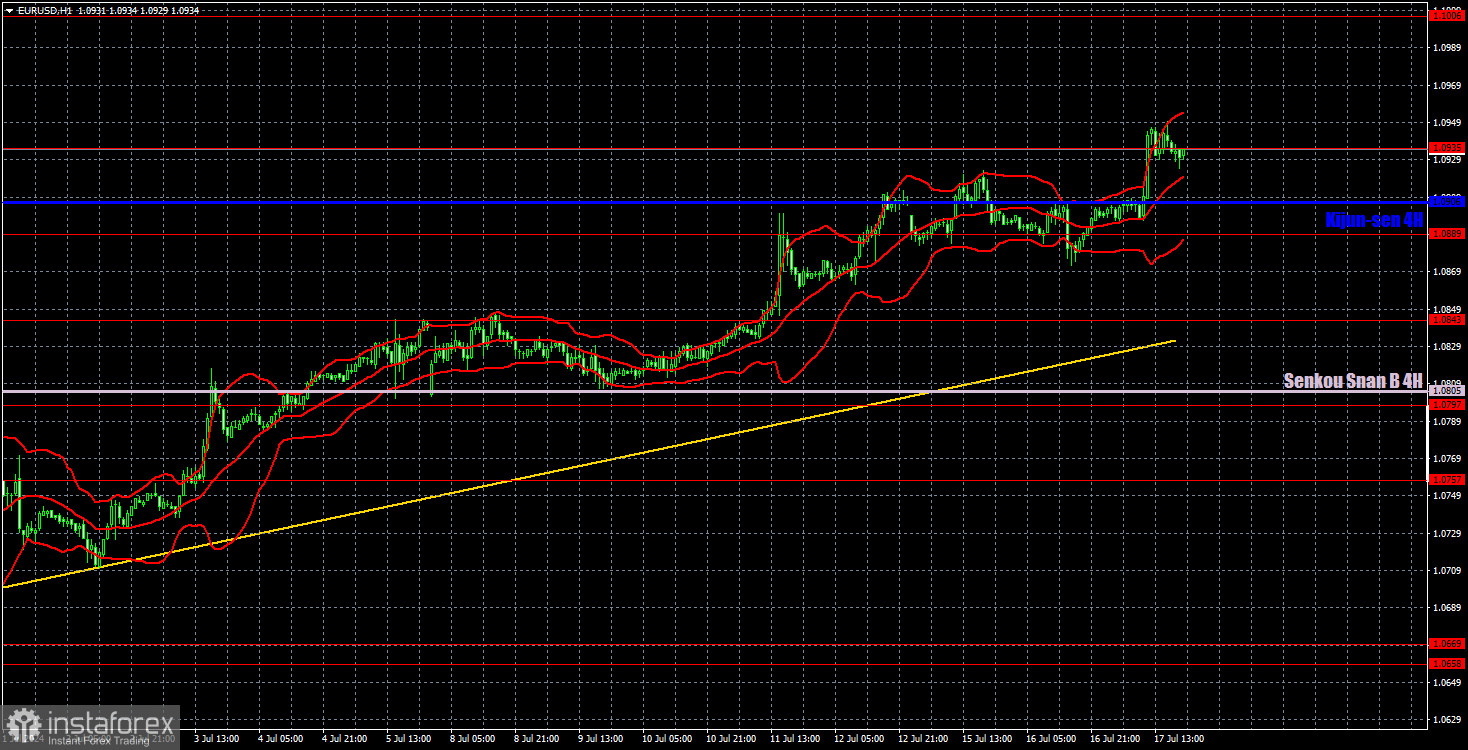
From a technical perspective, everything is quite simple and clear. The upward trend has remained intact on the hourly timeframe for several weeks and during all this time the price has not even tried to consolidate below the trend line. Therefore, the price is progressively moving upward. Recall that the 24-hour timeframe shows that the price is trading between 1.0650 and 1.1000 in 2024. Therefore, we believe that the closer the level of 1.1000, the higher the probability of a bearish reversal.
The pair formed a buy signal on Tuesday evening, when the price breached the level of 1.0889. We mentioned that with the current volatility, it might take a few days for the price to reach the target level. On Wednesday, the euro reached the level of 1.0935, surpassed it, and consolidated below this mark. Therefore, it was possible to leave long positions on the last signal. Traders could gain 25 pips. Volatility remains very low.
COT report:

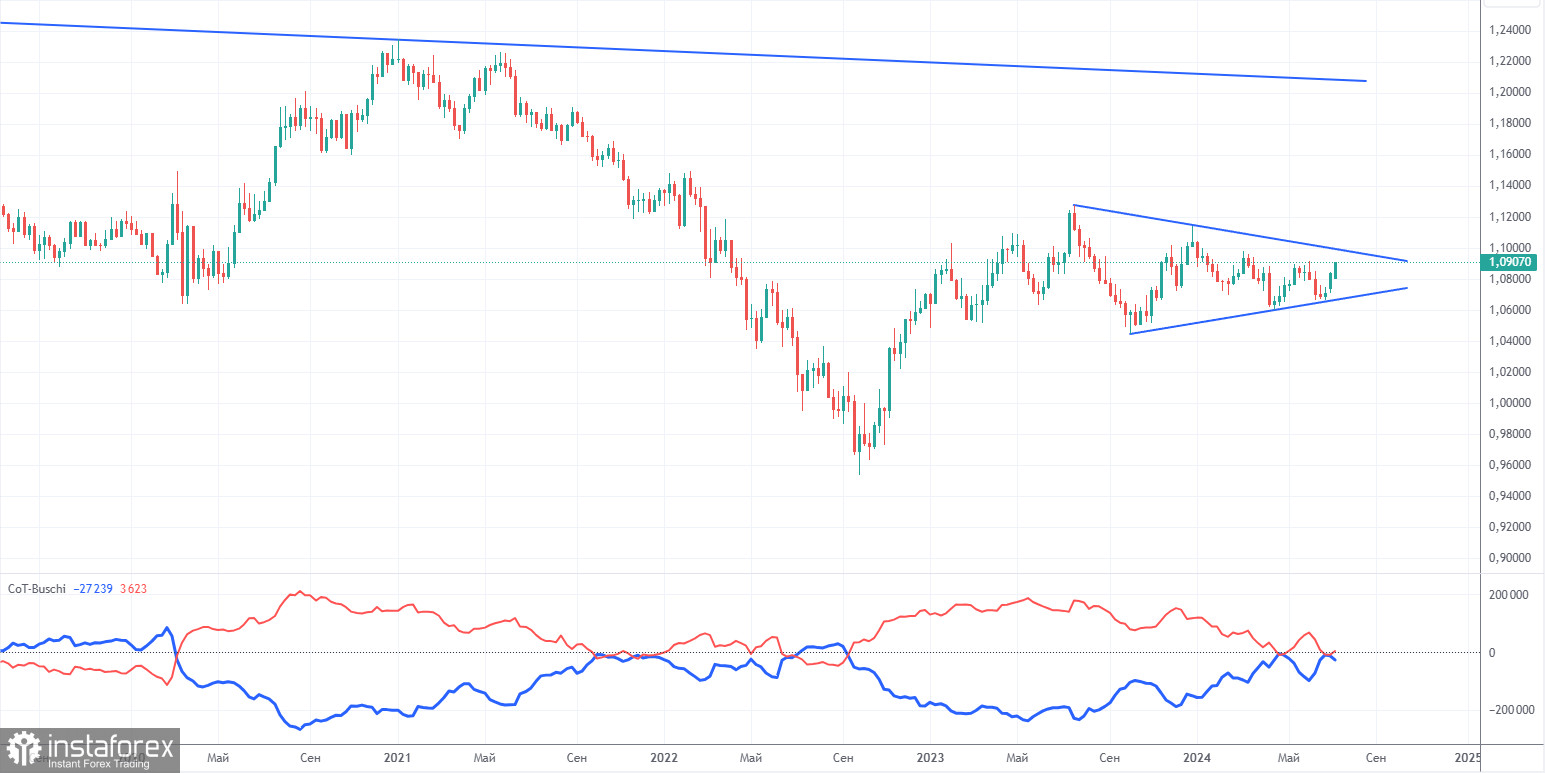
The latest COT report is dated July 9. The net position of non-commercial traders has remained bullish for a long time. The bears' attempt to gain dominance failed miserably. The net position of non-commercial traders (red line) has been declining in recent months, while that of commercial traders (blue line) has been growing. Currently, they are approximately equal, indicating the bears' new attempt to seize the initiative.
We don't see any fundamental factors that can support the euro's strength, while technical analysis also suggests that the price is in the consolidation zone – in a triangle. Now the pair's movement will depend on which border the price leaves.
Currently, the red and blue lines are approaching each other, which indicates a build-up in short positions on the euro. During the last reporting week, the number of long positions for the non-commercial group decreased by 1,500, while the number of short positions decreased by 11,600. As a result, the net position increased by 13,100. According to the COT reports, the euro still has significant potential for a decline.
Analysis of EUR/USD 1H

On the 1-hour chart, EUR/USD continues to form a new uptrend. We currently have an ascending trend line, above which the upward trend remains intact. All the economic reports from the past two weeks had a devastating impact on the dollar, so there is no sign of a decline. Meanwhile, the global downtrend persists on the 24-hour timeframe, which means that the pair could still fall back to the 1.06 level.
On July 18, we highlight the following levels for trading: 1.0530, 1.0581, 1.0658-1.0669, 1.0757, 1.0797, 1.0843, 1.0889, 1.0935, 1.1006, 1.1092, as well as the Senkou Span B (1.0805) and Kijun-sen (1.0906) lines. The Ichimoku indicator lines can move during the day, so this should be taken into account when identifying trading signals. Don't forget to set a Stop Loss to breakeven if the price has moved in the intended direction by 15 pips. This will protect you against potential losses if the signal turns out to be false.
On Thursday, the results of the ECB meeting will be announced, but there is no intrigue here. Rates are expected to remain unchanged. ECB President Christine Lagarde's speech carries more significance as she could hint at what traders can expect at the next meeting in September. The US docket only features a standard report on claims for unemployment benefits.
Description of the chart:
Support and resistance levels are thick red lines near which the trend may end. They do not provide trading signals;
The Kijun-sen and Senkou Span B lines are the lines of the Ichimoku indicator, plotted to the 1H timeframe from the 4H one. They provide trading signals;
Extreme levels are thin red lines from which the price bounced earlier. They provide trading signals;
Yellow lines are trend lines, trend channels, and any other technical patterns;
Indicator 1 on the COT charts is the net position size for each category of traders;


