


Trend Analysis (Fig. 1)
Today, GBP/USD may start falling from the level of 1.3004 (yesterday's daily candle close) towards the target of 1.2980 – the retracement level of 14.6% (dashed red line). Upon reaching this level, the price may continue to rise towards the target of 1.3043 – the upper fractal (blue dashed line).
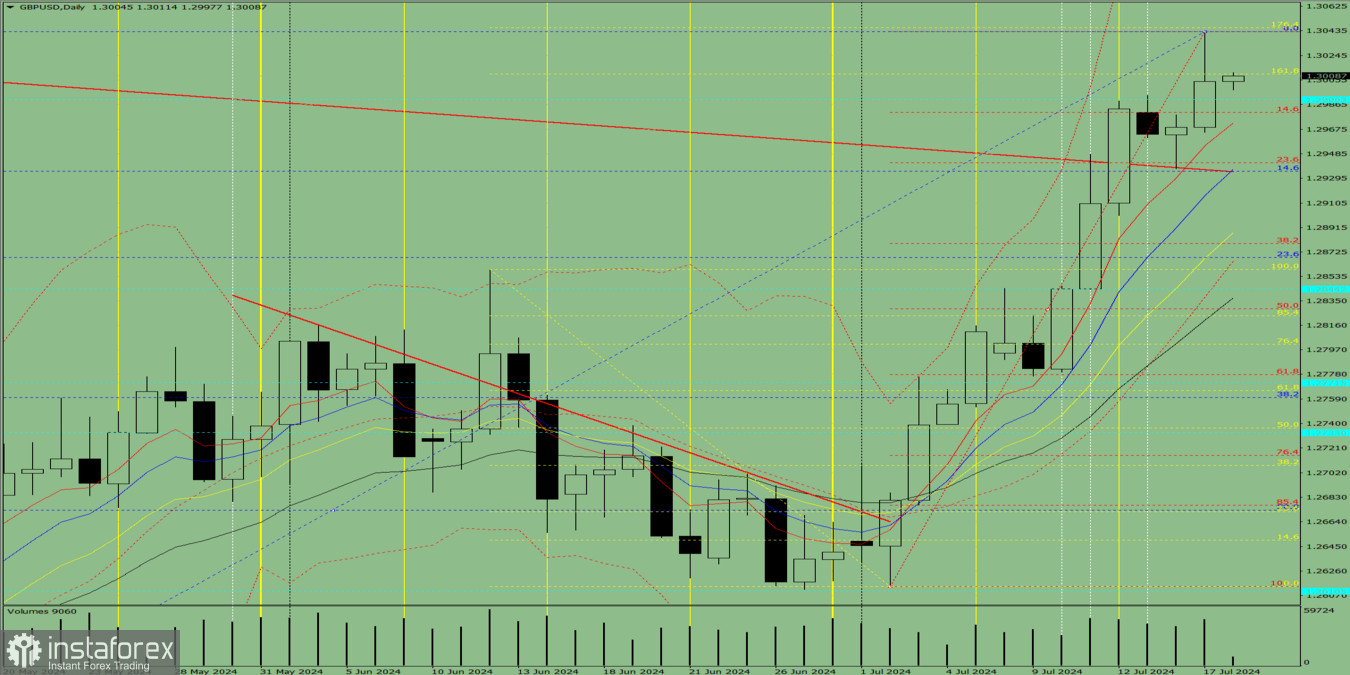
Fig. 1 (daily chart)
Comprehensive Analysis:
- Indicator Analysis – downwards;
- Fibonacci Levels – downwards;
- Volumes – downwards;
- Candlestick Analysis – downwards;
- Trend Analysis – upwards;
- Bollinger Bands – upwards;
- Weekly Chart – upwards.
General Conclusion:
Today, GBP/USD may start falling from the level of 1.3004 (yesterday's daily candle close) towards the target of 1.2980 – the retracement level of 14.6% (dashed red line). Upon reaching this level, the price may continue to rise towards the target of 1.3043 – the upper fractal (blue dashed line).
Alternative Scenario: GBP/USD may start falling from the level of 1.3004 (yesterday's daily candle close) towards the target of 1.2941 – the retracement level of 23.6% (dashed red line). Upon reaching this level, the price may continue to rise towards the target of 1.3043 – the upper fractal (blue dashed line).


