


Analyzing Friday's trades:
GBP/USD on 1H chart
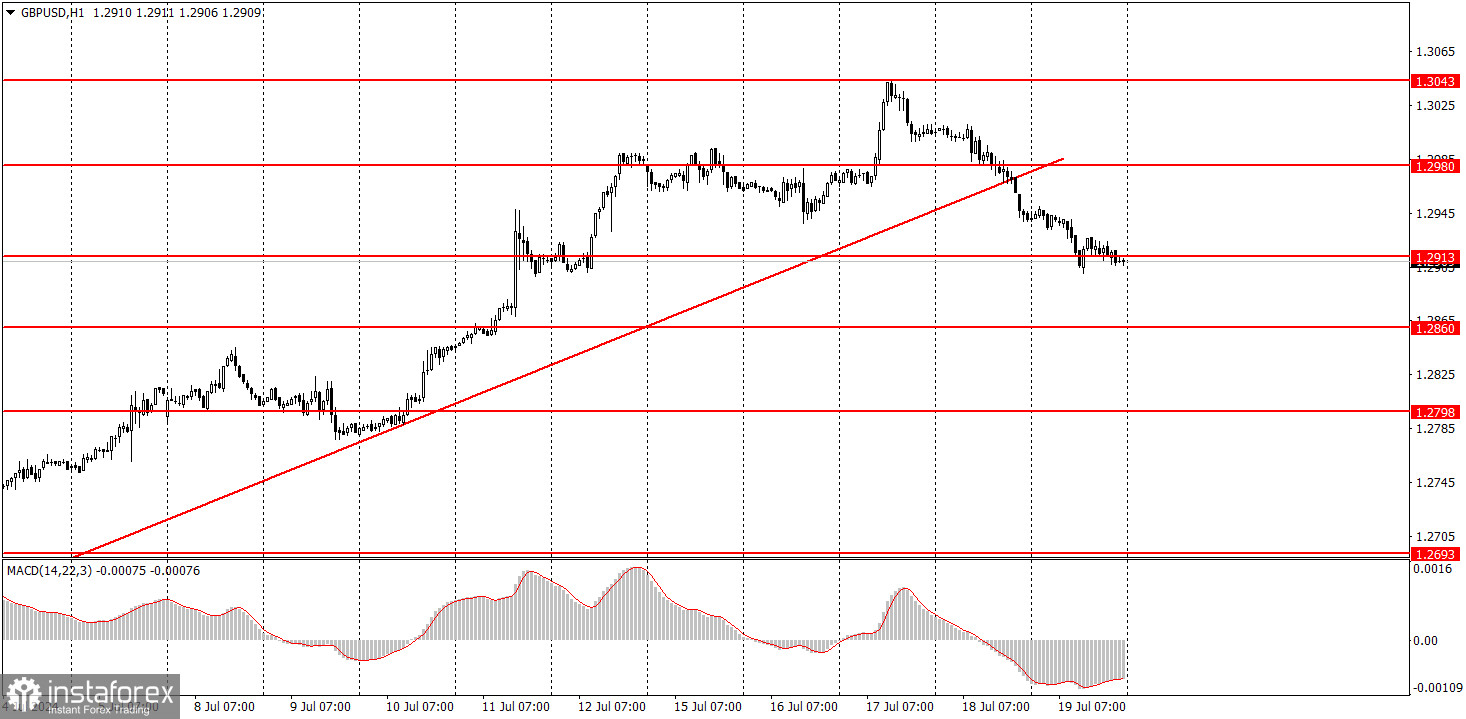
The GBP/USD pair continued to trade lower on Friday after settling below the ascending trendline. In recent months, the pound sterling has often shown growth that is not supported by fundamentals or macroeconomics. Therefore, we are very cautious about the potential change to a downward trend. Undoubtedly, the pound sterling cannot rise indefinitely, but in the past few months, there have been 5 or 6 instances where the price broke through the ascending trendline, and no decline followed.
On Friday, the only report of the day caused the British currency to fall. The UK retail sales report showed a 1.2% decline in volumes in June against forecasts of -0.4%. It cannot be said that the pound fell too much, as the pair's volatility remains relatively low. Nevertheless, it lost about 30 pips during the day. We still believe that the pound sterling is overbought and unjustifiably expensive. Currently, we have at least one signal of a trend change, so it makes sense to expect the pound to fall.
GBP/USD on 5M chart
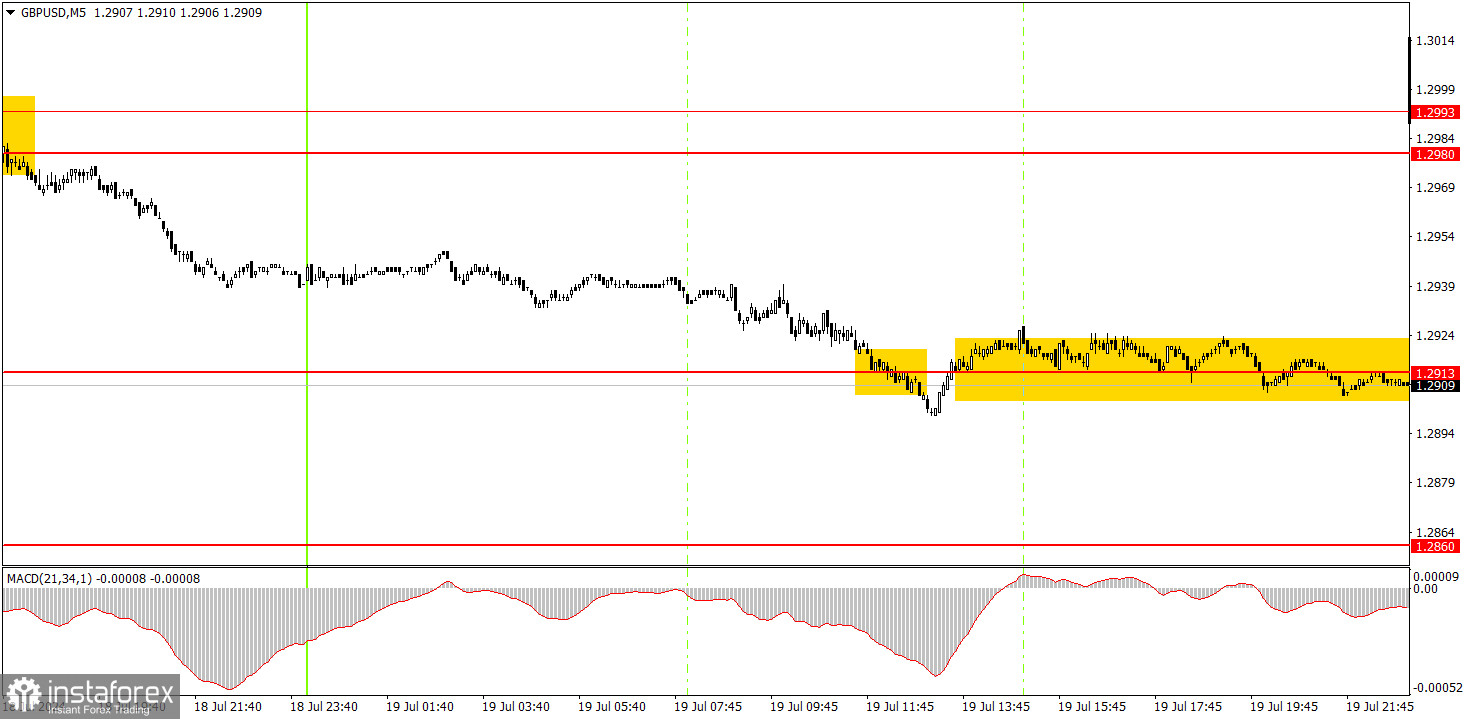
On the 5-minute timeframe on Friday, the pair continued to decline after breaking through the 1.2980-1.2993 area, which happened on Thursday. In the previous article, we mentioned that it was advisable to stay in short positions, as it is quite rare for a signal to be worked out within a single day. Usually, the trade has to be carried over to the next day to achieve the target level or area. On Friday, the pair reached the target level of 1.2913. The short positions could have been closed almost any time since the movement ceased altogether after the pair reached 1.2913.
Trading tips on Monday:
On the hourly timeframe, GBP/USD finally has a chance of at least a slight decline. The ascending trendline has been broken, so we might see at least a correction. Ideally, the pound should drop at least 400-500 pips. The market has already priced in all growth factors about three times, the dollar is undervalued, and the Bank of England might start lowering its rates soon. And even if both the BoE and the Federal Reserve start cutting rates simultaneously, why is it that only the dollar is falling in such a fundamental scenario?
On Monday, novice traders can trade from the 1.2913 level. However, there might be a flat market and several false signals around this level. Caution is advised. The pound had macroeconomic reasons to fall on Friday, which might not be present on Monday.
The key levels to consider on the 5M timeframe are 1.2605-1.2633, 1.2684-1.2693, 1.2748, 1.2791-1.2798, 1.2848-1.2860, 1.2913, 1.2980-1.2993, 1.3043, 1.3102-1.3107, 1.3145. On Monday, no significant reports or events are scheduled in the UK or the US. The pair may experience low volatility with flat dynamics or edge slightly lower.
Basic rules of a trading system:
1) The strength of a signal is determined by the time it took for the signal to form (bounce or level breakthrough). The shorter the time required, the stronger the signal.
2) If two or more trades around a certain level are initiated based on false signals, subsequent signals from that level should be ignored.
3) In a flat market, any currency pair can produce multiple false signals or none at all. In any case, it's better to stop trading at the first signs of a flat market.
4) Trades should be opened between the start of the European session and mid-way through the U.S. session. All trades must be closed manually after this period.
5) In the hourly time frame, trades based on MACD signals are only advisable amidst substantial volatility and an established trend, confirmed either by a trendline or trend channel.
6) If two levels are too close to each other (from 5 to 20 pips), they should be considered as a support or resistance zone.
7) After moving 15 pips in the intended direction, the Stop Loss should be set to break-even.
What the charts show:
Support and Resistance price levels can serve as targets when buying or selling. You can place Take Profit levels near them.
Red lines represent channels or trend lines that depict the current trend and indicate the preferred trading direction.
The MACD (14,22,3) indicator, encompassing both the histogram and signal line, acts as an auxiliary tool and can also be used as a source of signals.
Important speeches and reports (always noted in the news calendar) can profoundly influence the price dynamics. Hence, trading during their release calls for heightened caution. It may be reasonable to exit the market to prevent abrupt price reversals against the prevailing trend.
Beginners should always remember that not every trade will yield profit. Establishing a clear strategy, coupled with effective money management, is key to long-term success in trading.


