


Last week, the S&P 500 fell by 2.95% from its record peak, forming a divergence with the Marlin oscillator on the weekly chart. Fibonacci rays indirectly confirm the peak and reversal. Our task is to determine the timing and depth of the ongoing correction.
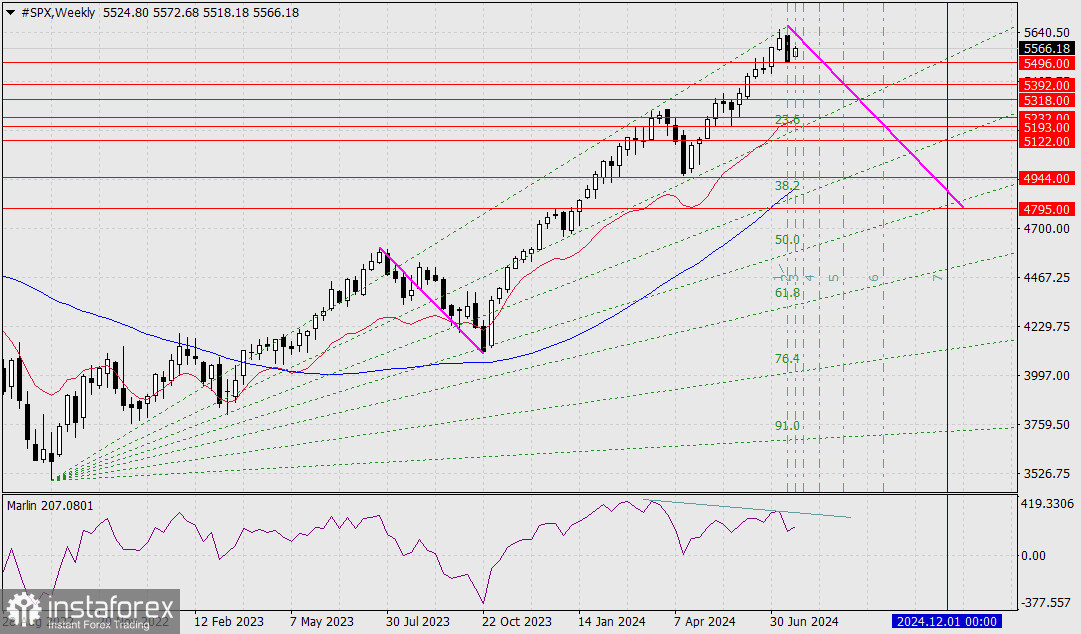
On the weekly chart, there is a magnetic point at the intersection of four lines: the 50% Fibonacci ray, the target level of 4795 – the peak of December 2023, the trendline from the July-October 2023 correction, and the Fibonacci timeline of order number 7. This gives us a timeframe of late November to early December of the current year. This period will coincide with the conclusion of the U.S. presidential elections and the announcement of the new president's plans, whoever that may be. Therefore, the index could hit new record highs when the S&P 500 falls 15.4% from its all-time high at 4795.
Intermediate targets on the way to 4795:
- 5496 – Low of July 19
- 5392 – Low of June 14
- 5318 – Low of June 7
- 5193-5232 – Consolidation in early April
- 5122 – High of April 29
- 4944 – Low of February 21


