


Trend Analysis (Fig. 1)
Today, GBP/USD may continue the downward movement from the level of 1.2903 (the close of yesterday's daily candle) with a target at the 38.2% retracement level, 1.2879 (red dotted line). Upon testing this level, the price may start rising with a target at 1.2934 – the 23.6% retracement level (red dotted line).
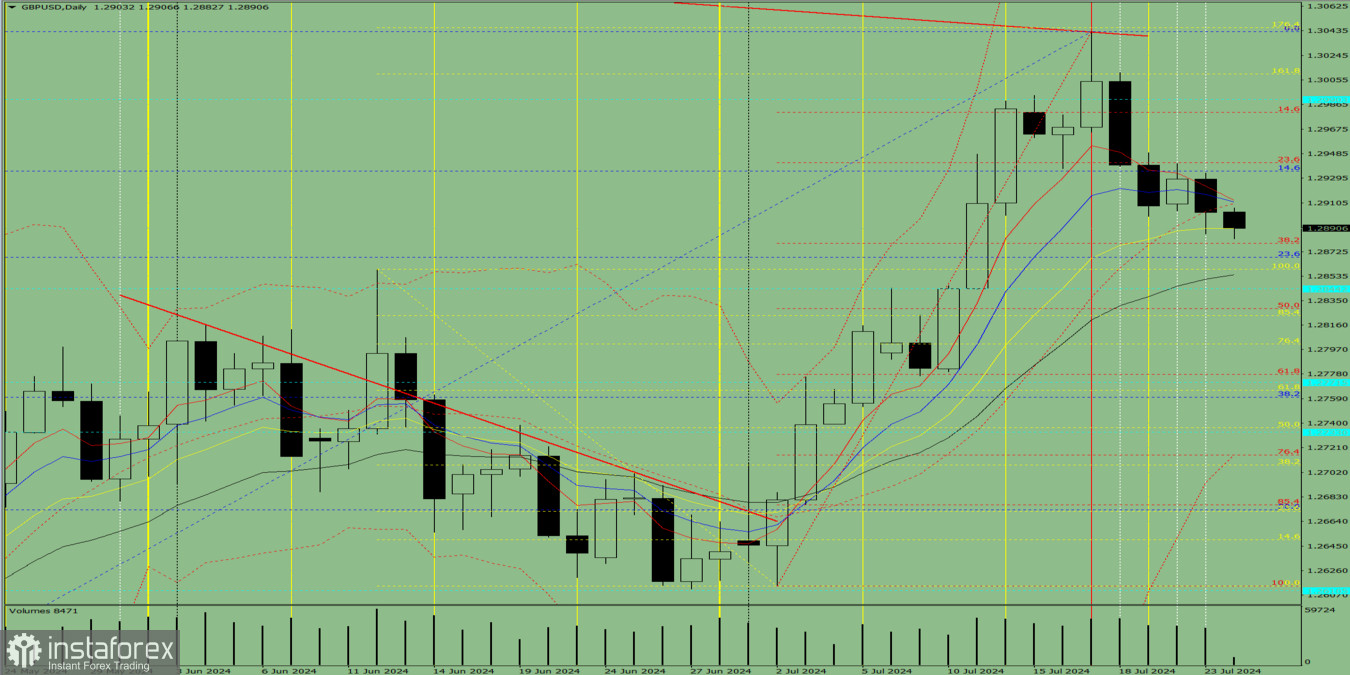
Fig. 1 (daily chart)
Comprehensive Analysis:
- Indicator Analysis – Up
- Fibonacci Levels – Up
- Volumes – Up
- Candlestick Analysis – Up
- Trend Analysis – Up
- Weekly Chart – Up
- Bollinger Bands – Up
General Conclusion:
Today, GBP/USD may continue the downward movement from the level of 1.2903 (the close of yesterday's daily candle) with a target at the 38.2% retracement level, 1.2879 (red dotted line). Upon testing this level, the price may start rising with a target at 1.2934 – the 23.6% retracement level (red dotted line).
Alternative Scenario: The pair may continue to fall from the level of 1.2903 (the close of yesterday's daily candle) to the 23.6% retracement level at 1.2869 (blue dotted line). Upon testing this level, the price may start moving upwards with a target at 1.2934 – the 23.6% retracement level (red dotted line).


