


Analysis of macroeconomic reports:
Several macroeconomic events are scheduled for Thursday. The economic calendar is light for the Eurozone, Germany, and the UK, but the US will release three relatively important indicators. The US GDP report does not always provoke any market reaction, but it should not be ignored, as it shows the state of the American economy. The durable goods orders report is vital because these goods are costly, and changes in sales volumes reflect consumers' willingness or unwillingness to make large purchases. The unemployment claims report is the least important of all.
Analysis of fundamental events:
From Thursday's fundamental events, only a speech by European Central Bank President Christine Lagarde stands out. It is challenging to expect new statements from her that the market has yet to hear. However, the tone of her speech may indicate how prepared the ECB is to lower key rates for the second time in September. We believe that Lagarde will not hint at the September meeting today and will again limit herself to the phrase "everything will depend on incoming information."
General conclusions:
Today, notable events include Lagarde's speech and US data. All three events could provoke a market reaction. It is impossible to predict the direction in which both pairs will move after these events. Therefore, one should be prepared for movement in either direction. A decline in both currency pairs seems likely, but bullish corrections are still possible.
Basic rules of a trading system:
1) The strength of a signal is determined by the time it took for the signal to form (bounce or level breakthrough). The shorter the time required, the stronger the signal.
2) If two or more trades around a certain level are initiated based on false signals, subsequent signals from that level should be ignored.
3) In a flat market, any currency pair can produce multiple false signals or none at all. In any case, it's better to stop trading at the first signs of a flat market.
4) Trades should be opened between the start of the European session and mid-way through the U.S. session. All trades must be closed manually after this period.
5) In the hourly time frame, trades based on MACD signals are only advisable amidst substantial volatility and an established trend, confirmed either by a trendline or trend channel.
6) If two levels are too close to each other (from 5 to 20 pips), they should be considered as a support or resistance zone.
7) After moving 15 pips in the intended direction, the Stop Loss should be set to break-even.
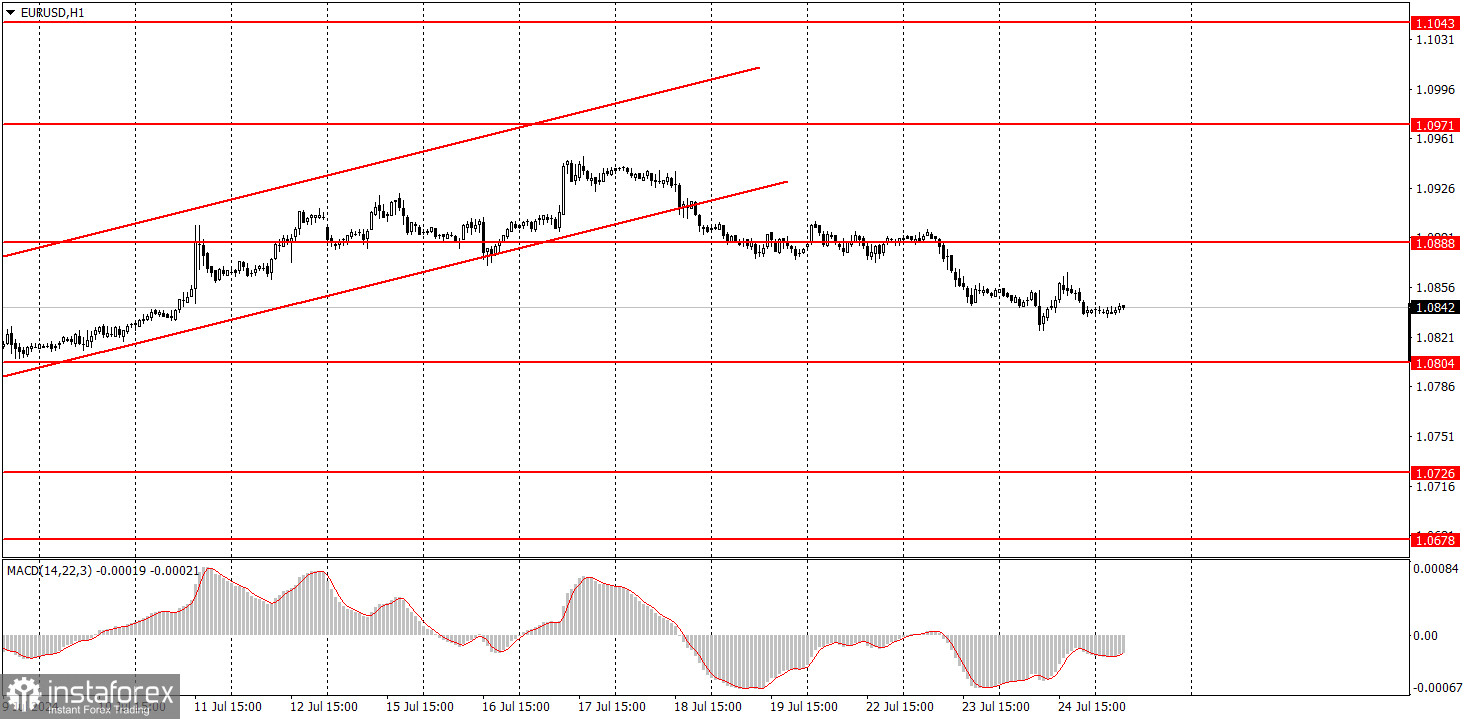
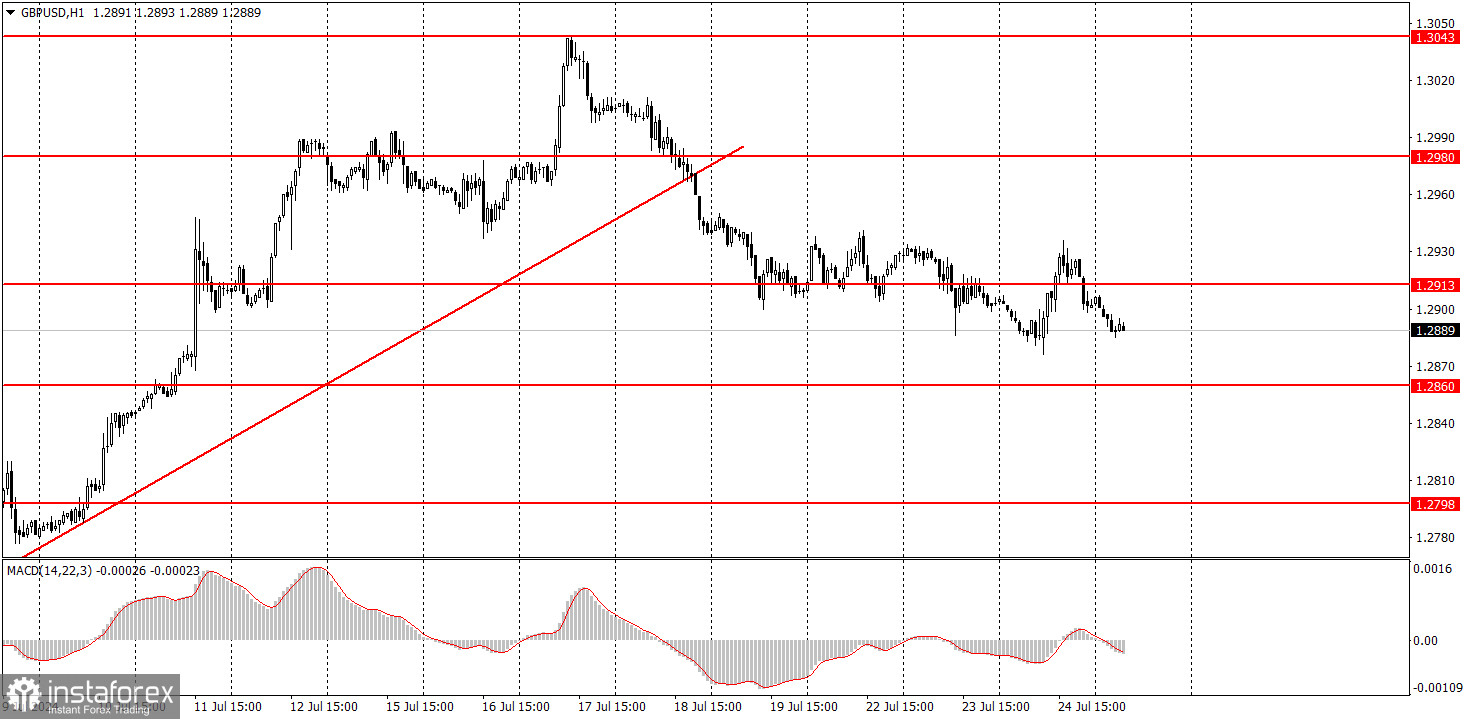
What the charts show:
Support and Resistance price levels can serve as targets when buying or selling. You can place Take Profit levels near them.
Red lines represent channels or trend lines that depict the current trend and indicate the preferred trading direction.
The MACD (14,22,3) indicator, encompassing both the histogram and signal line, acts as an auxiliary tool and can also be used as a source of signals.
Important speeches and reports (always noted in the news calendar) can profoundly influence the price dynamics. Hence, trading during their release calls for heightened caution. It may be reasonable to exit the market to prevent abrupt price reversals against the prevailing trend.
Beginners should always remember that not every trade will yield profit. Establishing a clear strategy, coupled with effective money management, is key to long-term success in trading.


