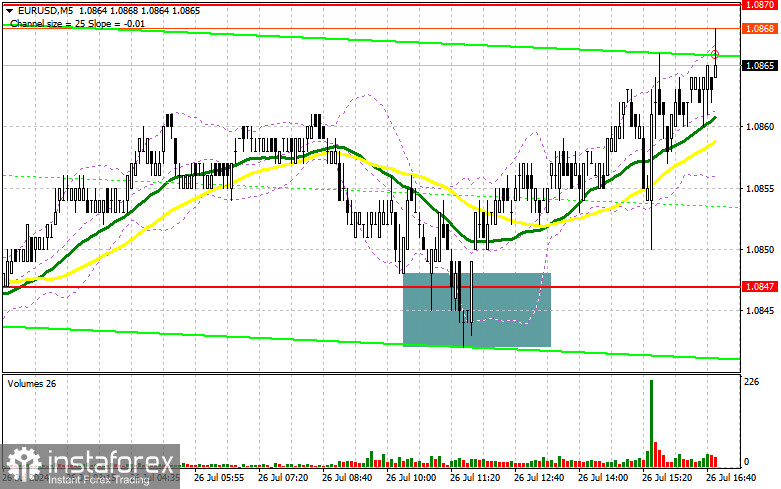
In my morning forecast, I paid attention to the level of 1.0847 and planned to make trading decisions from it. Let's look at the 5-minute chart and see what happened there. A decline and the formation of a false breakout provided a buying point for the euro, resulting in the pair rising to around 1.0870, yielding about 20 points of profit. The technical picture for the second half of the day has hardly been revised.

For Opening Long Positions on EUR/USD:
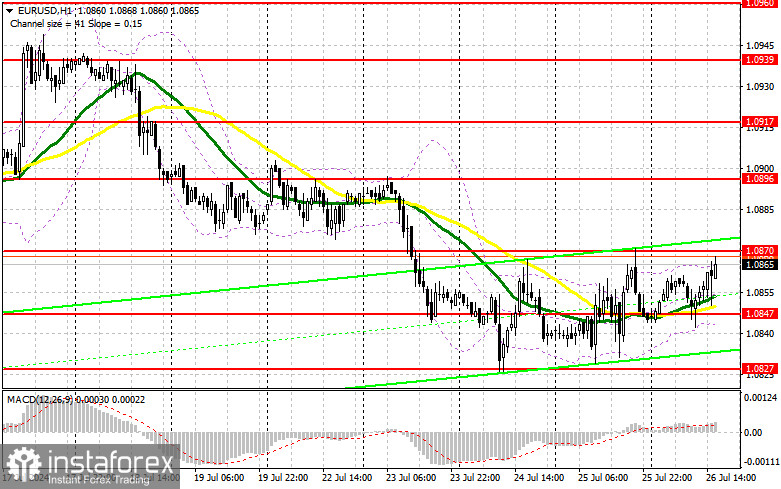
We are expecting very interesting statistics from the US, but the reaction to them may be much more restrained than to yesterday's GDP data. The core personal consumption expenditures index and the levels of consumer spending and income in the US will be of greater interest. Less attention will be paid to the University of Michigan consumer sentiment index and inflation expectations. In case of a decline in the pair, the formation of a false breakout at 1.0847, similar to what I discussed above, will be a suitable condition for building up long positions in anticipation of a surge in the pair with a prospect of updating 1.0870 – resistance, above which it has not yet managed to break through. A breakout and an update from top to bottom of this range will strengthen the pair with a chance to rise to the area of 1.0896. The farthest target will be the maximum of 1.0917, where I will take profit. In the scenario of a decline in EUR/USD and a lack of activity around 1.0847 in the second half of the day, and since this level has already worked itself out once, sellers will regain the initiative at the end of the week and start taking active actions in anticipation of further decline. In this case, I will only enter after forming a false breakout around the next lower boundary of the sideways channel 1.0827. I plan to open long positions immediately on a rebound from 1.0808, aiming for an upward correction of 30-35 points intraday.
For Opening Short Positions on EUR/USD:
Sellers can only rely on the resistance at 1.0870, where a false breakout will confirm the presence of large players betting on the euro's decline, providing a suitable entry point for short positions aiming to lower EUR/USD to the support of 1.0847 – the middle of the channel, where the moving averages are also located, supporting the bulls. A breakout and consolidation below this range, as well as a reverse test from bottom to top, will provide another selling point, with a move towards 1.0827, where I expect to see more active buyer participation. The farthest target will be the area of 1.0808, where I will take profit. In case of an upward move in EUR/USD in the second half of the day, and the absence of bears at 1.0870 at the end of the week, buyers will feel empowered to aim for a larger rise. In this case, I will postpone sales until the next resistance test at 1.0896. I will also sell there, but only after an unsuccessful consolidation. I plan to open short positions immediately on a rebound from 1.0917, aiming for a downward correction of 30-35 points.

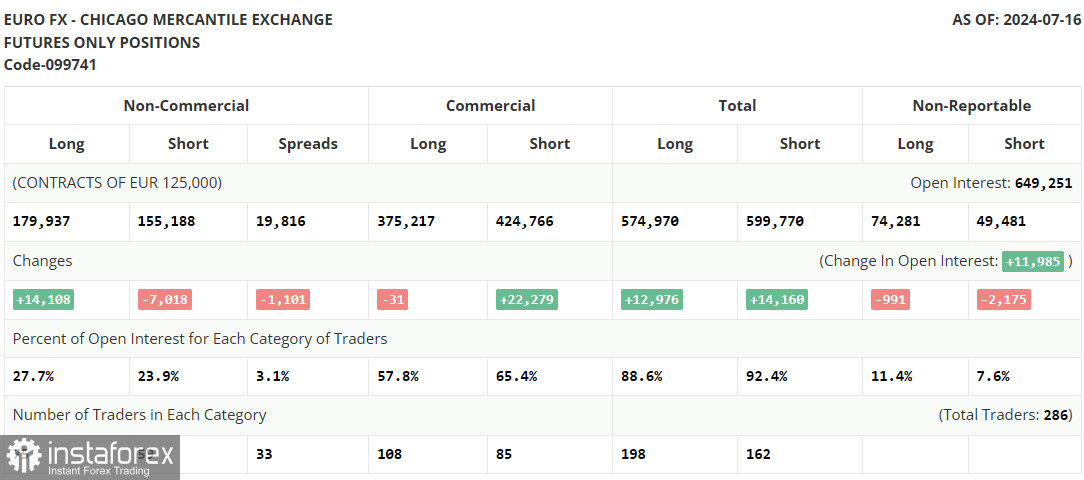
In the COT report (Commitment of Traders) for July 16, there was a decrease in short and an increase in long positions. It is evident that talks around the reduction of interest rates in the US and the pause planned by the European Central Bank have fueled demand for risk assets, including the euro, supporting market growth. But after all the important data was published and decisions were made – talking about the ECB meeting and maintaining rates unchanged, the market has calmed down, which may last until the end of this month. Only GDP data will be able to cause a spike in volatility. For this reason, it is best to stick to cautious trading within the channel. The COT report indicates that long non-commercial positions rose by 14,108 to the level of 179,937, while short non-commercial positions fell by 7,018 to the level of 155,188. As a result, the spread between long and short positions decreased by 1,101.
Indicator Signals:
Moving Averages:
Trading is below the 30 and 50-day moving averages, indicating a euro decline.
Note: The period and prices of the moving averages are considered by the author on the H1 hourly chart and differ from the general definition of classical daily moving averages on the D1 daily chart.
Bollinger Bands:
In case of a decline, the lower boundary of the indicator around 1.0829 will act as support.
Indicator Descriptions:
Moving Average (MA): Defines the current trend by smoothing volatility and noise. Period 50. Marked in yellow on the chart.
Moving Average (MA): Defines the current trend by smoothing volatility and noise. Period 30. Marked in green on the chart.
MACD Indicator (Moving Average Convergence/Divergence): Fast EMA period 12, Slow EMA period 26, SMA period 9.
Bollinger Bands: Period 20.
Non-commercial traders: Speculators such as individual traders, hedge funds, and large institutions using the futures market for speculative purposes and meeting certain requirements.
Long non-commercial positions: Represent the total long open position of non-commercial traders.
Short non-commercial positions: Represent the total short open position of non-commercial traders.
Total non-commercial net position: The difference between short and long positions of non-commercial traders.


