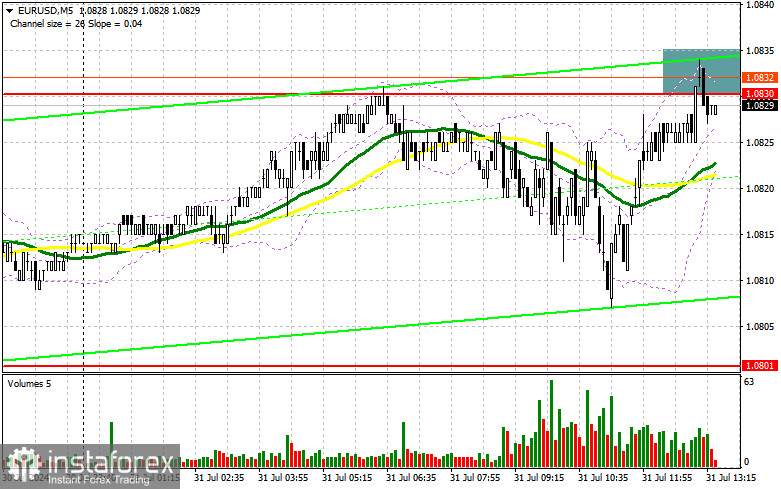
In my morning forecast, I highlighted the 1.0829 level and planned to make trading decisions from there. Let us examine the 5-minute chart to analyze what happened. The rise and formation of a false breakout led to a sell signal, but as of the time of writing, there hasn't been a significant downward movement. The technical picture for the second half of the day remains unchanged.

To Open Long Positions in EUR/USD:
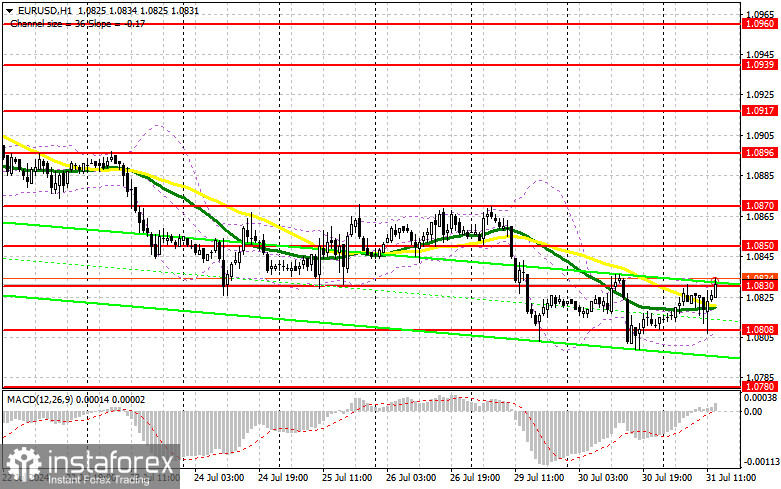
The news about the rise in inflation in the eurozone in July supported the European currency. However, it is too early to say that the bulls have taken the initiative. Everything will depend on the decisions of the Federal Reserve and the market's reaction to statements from its chairman, Jerome Powell. If his speech is dovish and he notes progress in achieving inflation targets, hinting that it might be time to end high interest rates, the euro could show much stronger growth than in the first half of the day. Otherwise, pressure on the pair will return, which I plan to take advantage of. If EUR/USD declines, a false breakout formation at 1.0808 would be suitable for building up long positions, expecting a surge of the pair upwards with the prospect of updating the mid-channel at 1.0830. A breakout and subsequent confirmation of this range will strengthen the pair with a chance to rise to the 1.0850 area. The furthest target will be the 1.0870 level, where I will take profit. Suppose EUR/USD declines and there is no activity around the technically important level of 1.0808 in the second half of the day. In that case, sellers will regain the initiative and build a downtrend. In this case, I will enter only after a false breakout from around 1.0780. I plan to open long positions immediately on a rebound from 1.0757 with the target of an upward correction of 30-35 points within the day.
To Open Short Positions in EUR/USD:
Sellers maintain control of the market, and all attempts by the euro to recover are immediately thwarted. Only a very strict position from Jerome Powell will allow the bearish market to continue. Otherwise, it will still be necessary to show resilience around 1.0830, with the help of U.S. statistics. ADP employment change numbers are expected, where a rise in new jobs with a false breakout around 1.0830 will confirm the presence of major players betting on the euro's fall, providing a suitable entry point for short positions to reduce EUR/USD to the 1.0808 support. A breakout and consolidation below this range and a reverse test from bottom to top will give another selling point, moving towards 1.0780, where I expect more active buyer engagement. The furthest target will be the 1.0757 level, where I will take profit. In the case of an upward move of EUR/USD in the afternoon and the absence of bears at 1.0830, buyers will feel stronger, betting on larger growth. In this case, I will postpone sales until testing the next resistance at 1.0850. I will also sell there, but only after an unsuccessful consolidation. I plan to open short positions immediately on a rebound from 1.0870 with the target of a downward correction of 30-35 points.

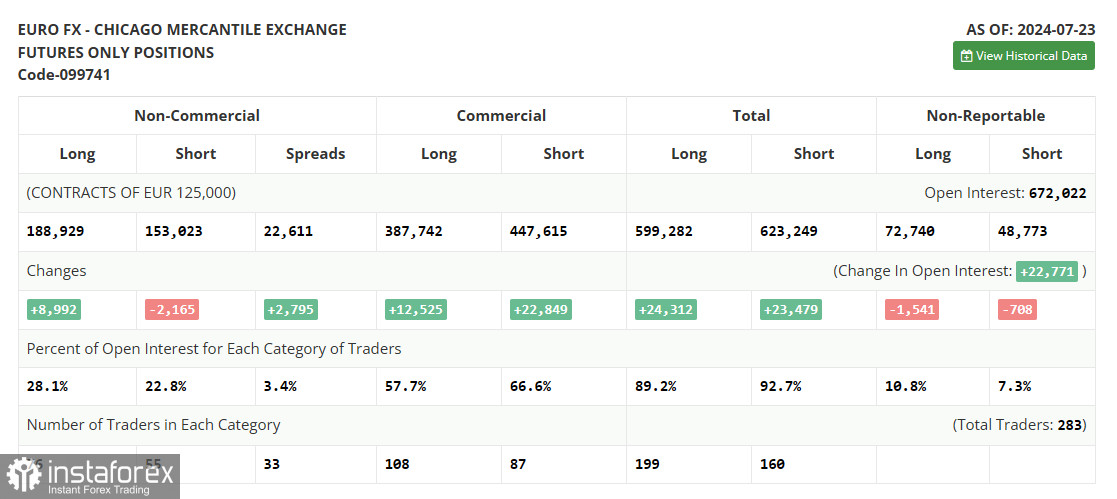
In the Commitment of Traders (COT) report for July 23, there was a reduction in short positions and an increase in long positions. However, looking at it closely, the balance of power has remained the same, and no new priorities were set ahead of the Federal Reserve meeting, despite talks that the American regulator needs to lower interest rates, as recent economic data suggests. With the market in equilibrium, one can take advantage of the cheaper risky assets, including the euro, and buy them in anticipation that the Fed will start lowering rates this year. The COT report indicated that long non-commercial positions increased by 8,992 to 188,929, while short non-commercial positions fell by 2,165 to 153,023. As a result, the spread between long and short positions increased by 2,795.
Indicator Signals:
Moving Averages:Trading is conducted around the 30 and 50-day moving averages, indicating a sideways market.Note: The author considers the period and prices of the moving averages on the hourly H1 chart and differs from the general definition of classic daily moving averages on the daily D1 chart.
Bollinger Bands:In the case of a decline, the lower boundary of the indicator, around 1.0808, will act as support.
Indicator Descriptions:
- Moving average: Smooth out volatility and noise to determine the current trend. Period – 50. Marked in yellow on the chart.
- Moving average: Smooth out volatility and noise to determine the current trend. Period – 30. Marked in green on the chart.
- MACD (Moving Average Convergence/Divergence): EMA Fast – Period 12. EMA Slow – Period 26. SMA – Period 9.
- Bollinger Bands: Period – 20.
- Non-commercial traders: Speculators like individual traders, hedge funds, and large institutions that use the futures market for speculative purposes and meet certain requirements.
- Long non-commercial positions: Total long open positions of non-commercial traders.
- Short non-commercial positions: Total short open positions of non-commercial traders.
Total non-commercial net position: The difference between short and long positions of non-commercial traders.


