


Trend Analysis (Fig. 1)
Today, GBP/USD may sustain the decline from 1.2852 (the close of yesterday's daily candle) with a target of 1.2778 – the 61.8% pullback level (red dashed line). Upon reaching this level, the price may start rising with a target of 1.2829 – the 50% pullback level (red dashed line).
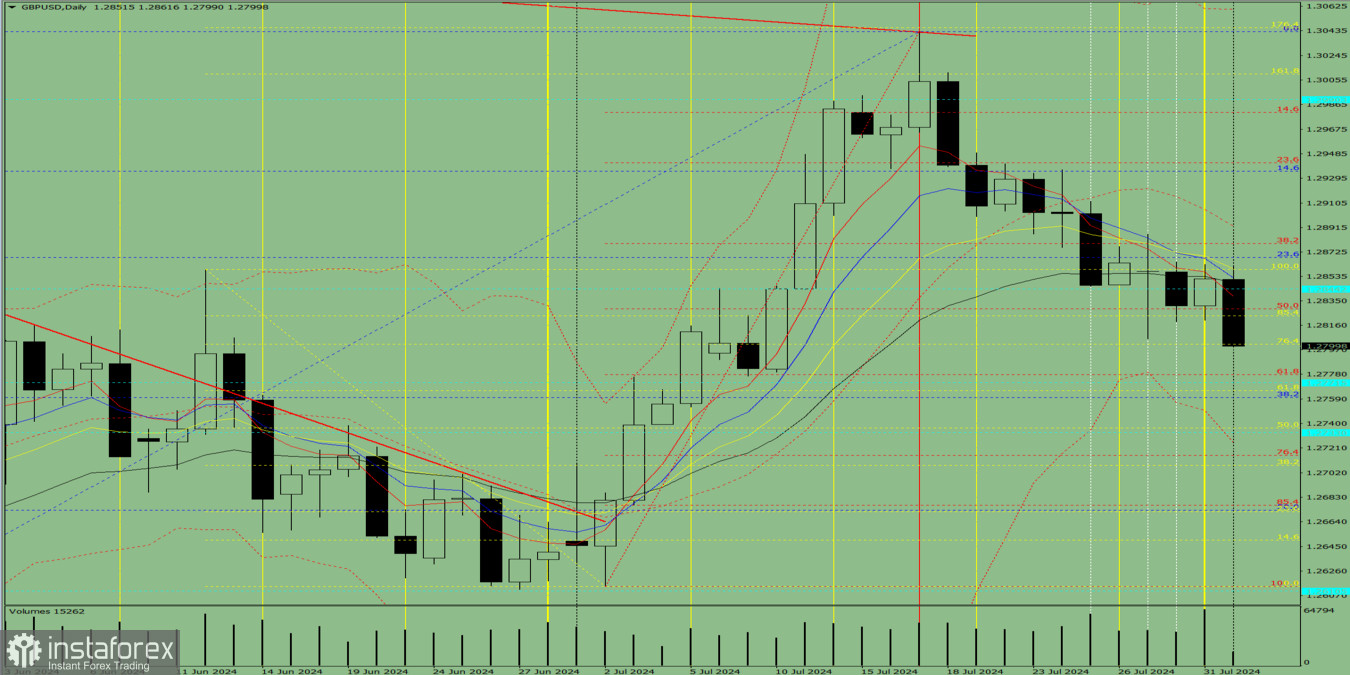
Fig. 1 (daily chart)
Comprehensive Analysis:
- Indicator Analysis – Down
- Fibonacci Levels – Down
- Volumes – Down
- Candlestick Analysis – Down
- Trend Analysis – Down
- Weekly Chart – Down
- Bollinger Bands – Down
General Conclusion:
Today, GBP/USD may sustain the decline from 1.2852 (the close of yesterday's daily candle) with a target of 1.2778 – the 61.8% pullback level (red dashed line). Upon reaching this level, the price may start rising with a target of 1.2829 – the 50% pullback level (red dashed line).
Alternative Scenario: The pair may sustain the decline from 1.2852 (the close of yesterday's daily candle) with a target of 1.2801 – the 76.4% pullback level (yellow dashed line). Upon reaching this level, the price may start rising with a target of 1.2829 – the 50% pullback level (red dashed line).


