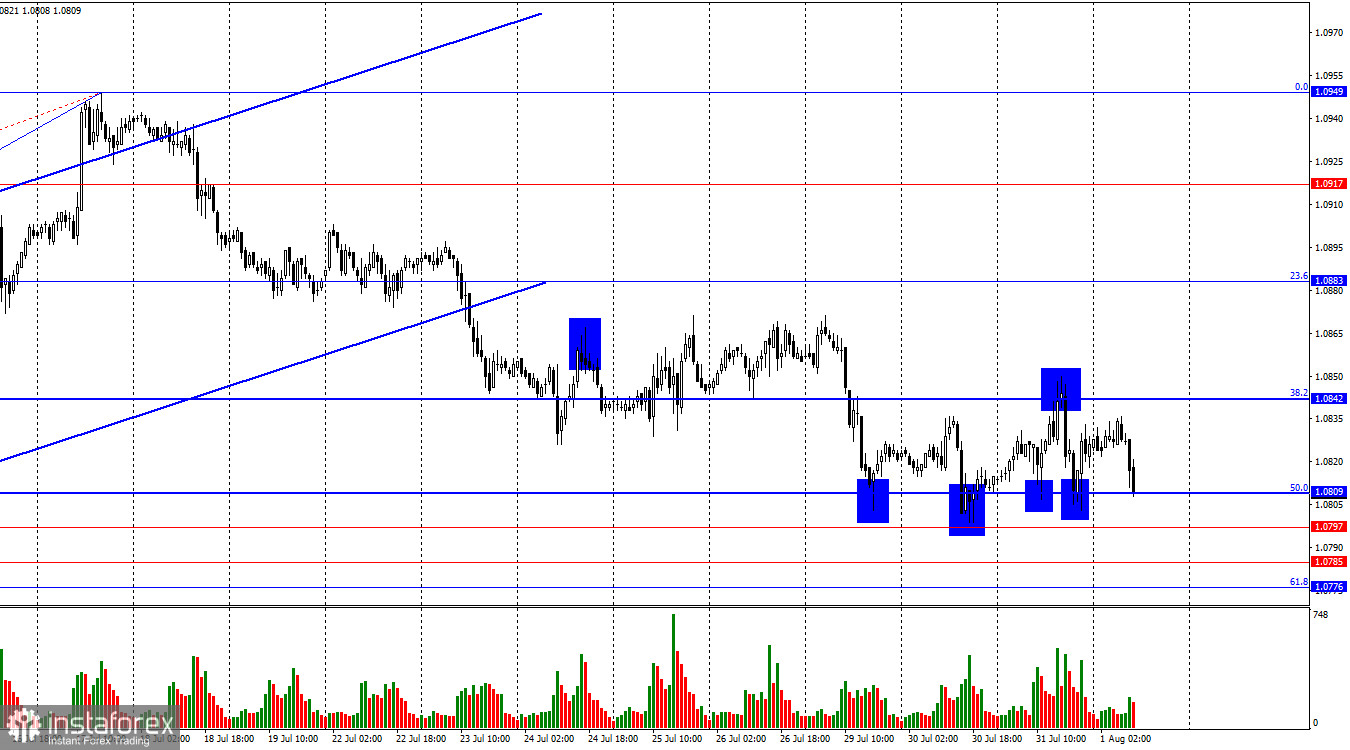
On Wednesday, the EUR/USD pair performed a new rise to the corrective level of 38.2% – 1.0842, rebounded from it, and fell to the Fibonacci level of 50.0% – 1.0809. Today, the pair's quotes made a new return to the 50.0% level. However, below this level, there are still three more levels that together form a support zone of 1.0776–1.0809. It will not be easy for the bears to overcome this. A rebound of the pair's rate from the 1.0809 level today will again allow for some growth of the pair.

The wave situation has become more complicated but does not raise any questions overall. The last upward wave broke the peak of the previous wave and is now considered complete. Thus, the bears have started forming a corrective wave. For the "bullish" trend to be canceled, the bears need to break the low of the previous downward wave, which is around the 1.0668 level. To do this, they need to move down another 170-180 points. With the current trader activity, this could take 2-3 weeks. A rapid decline is clearly not expected.
The information background on Wednesday was quite interesting. Inflation in the Eurozone rose to 2.6%, core inflation remained at 2.8%, and the Fed left interest rates unchanged. However, traders reacted rather coolly to this information, showing from early morning that they were only interested in Jerome Powell's speech. And it must be said that traders' reactions were quite ambiguous. Powell hinted that the regulator may lower interest rates at the next meeting (in September). Of course, he reiterated that the "FOMC decision will depend on incoming data and the state of the economy." However, this is one of the first instances in recent years where Powell has started talking about monetary policy easing specifically. Such information should have triggered the activation of bulls in the EUR/USD pair, as a rate cut is bad news for the dollar. However, we did not see a significant decline in the US currency.

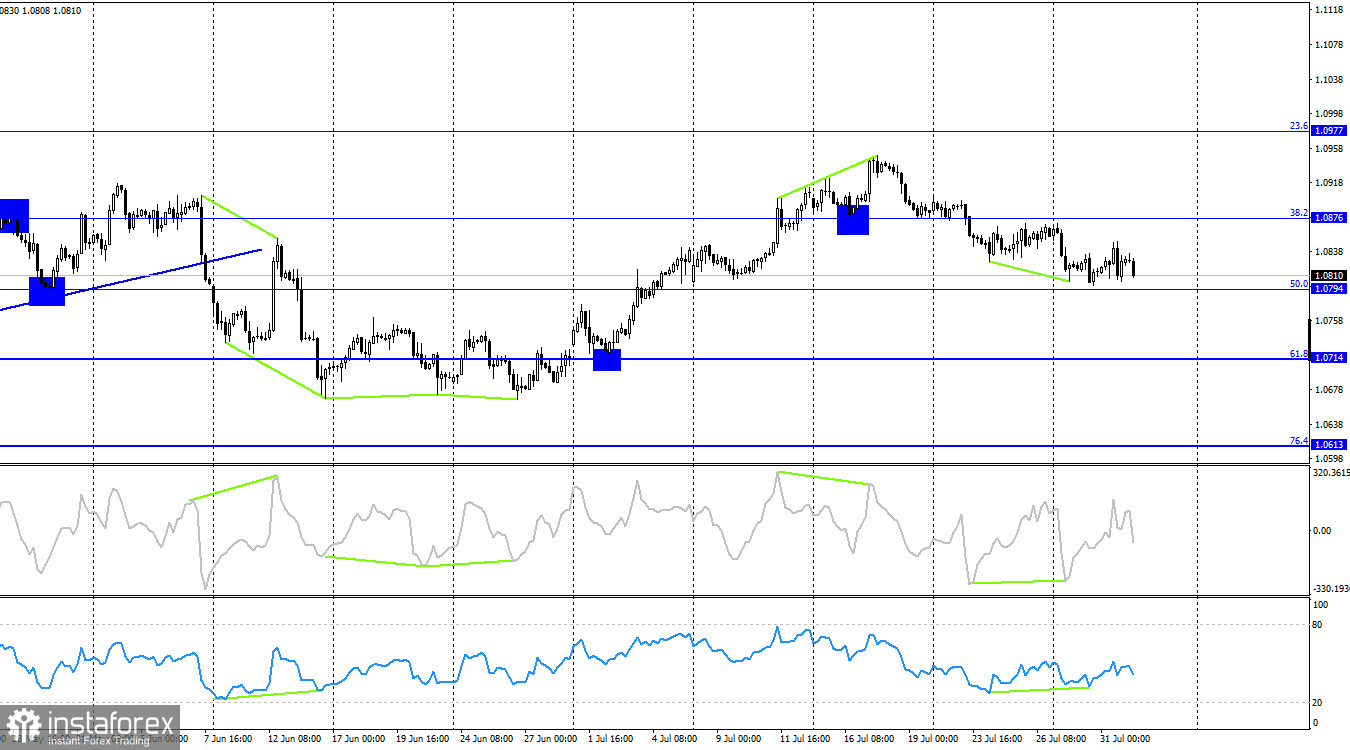
On the 4-hour chart, the pair reversed in favor of the US currency and secured below the corrective level of 38.2% – 1.0876. Thus, the decline process may continue towards the Fibonacci level of 50.0% – 1.0794. Securing quotes below the 1.0794 level will allow for further decline towards the next corrective level of 61.8% – 1.0714. A rebound of the pair's rate from the 1.0794 level will favor some growth of the euro.
Commitments of Traders (COT) Report:

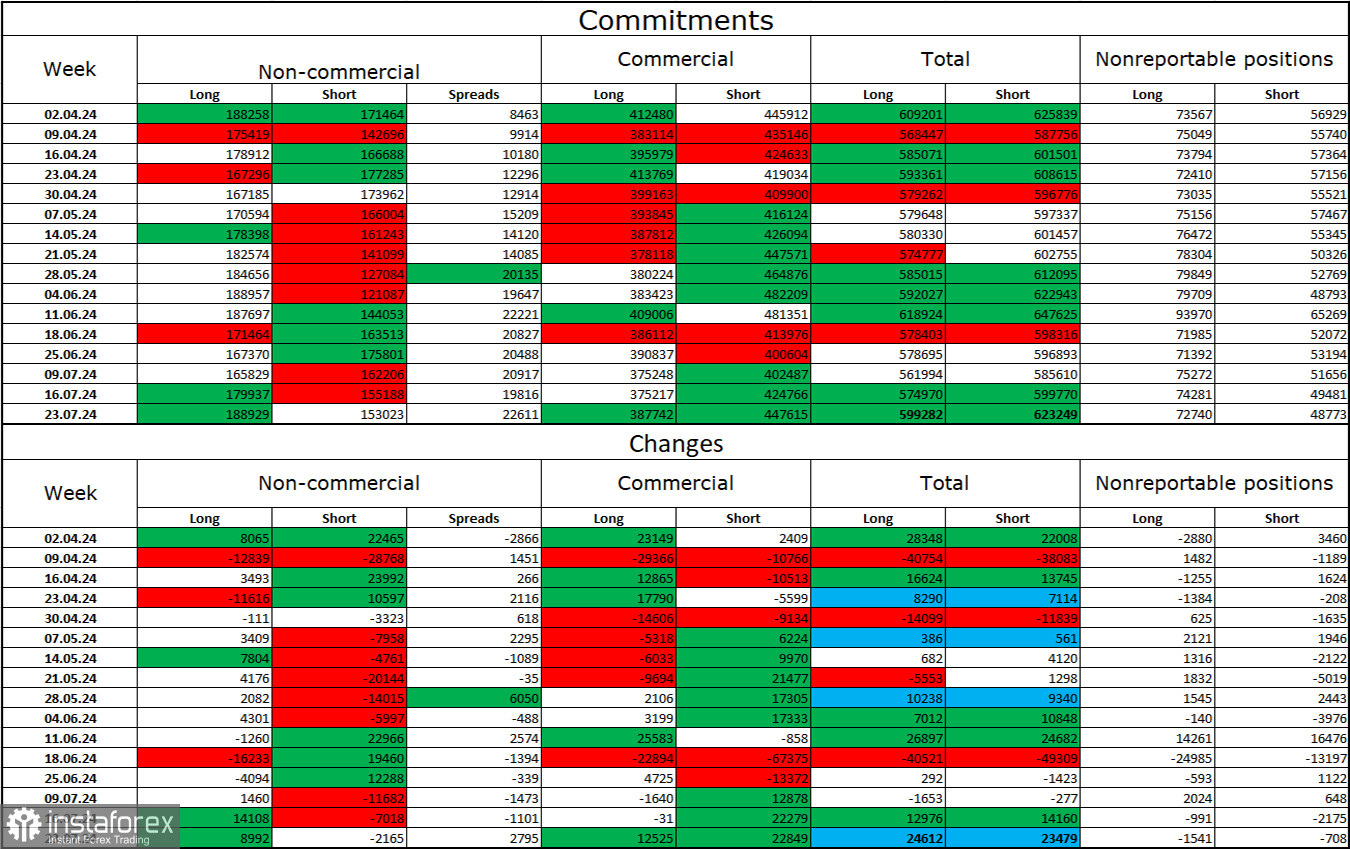
During the last reporting week, speculators opened 8,992 long positions and closed 2,165 short positions. The sentiment of the "Non-commercial" group turned "bearish" a couple of months ago, but currently, the bulls are dominating again. The total number of long positions held by speculators now stands at 189,000, and short positions at 153,000.
The situation will continue to change in favor of the bears. I do not see long-term reasons to buy the euro, as the ECB has started easing monetary policy, which will reduce the yield of bank deposits and government bonds. In America, they will remain at a high level for a few more months, making the dollar more attractive to investors. The potential for a decline in the European currency looks significant even according to the COT reports. However, one should remember graphical analysis, which currently does not allow confidently talking about a significant fall in the euro.
News Calendar for the US and the Eurozone:
- Eurozone – Germany Manufacturing PMI (07:55 UTC).
- Eurozone – Manufacturing PMI (08:00 UTC).
- Eurozone – Unemployment rate (09:00 UTC).
- US – Initial jobless claims (12:30 UTC).
- US – ISM Manufacturing PMI (14:00 UTC).
On August 1, the economic events calendar again contains quite important entries. The impact of the information background on trader sentiment today may be significant.
Forecast for EUR/USD and Trading Tips:
Sales of the pair were possible upon rebounding from the 1.0842 level on the hourly chart with a target of 1.0809. This target has been reached. Purchases can be considered with a target of 1.0842 upon rebounding from the 1.0809 level on the hourly chart. The pair's decline may continue, but there are many levels below on the hourly chart that may be difficult for the bears to overcome.
Fibonacci grids are built from 1.0668–1.0949 on the hourly chart and from 1.0450–1.1139 on the 4-hour chart.


