


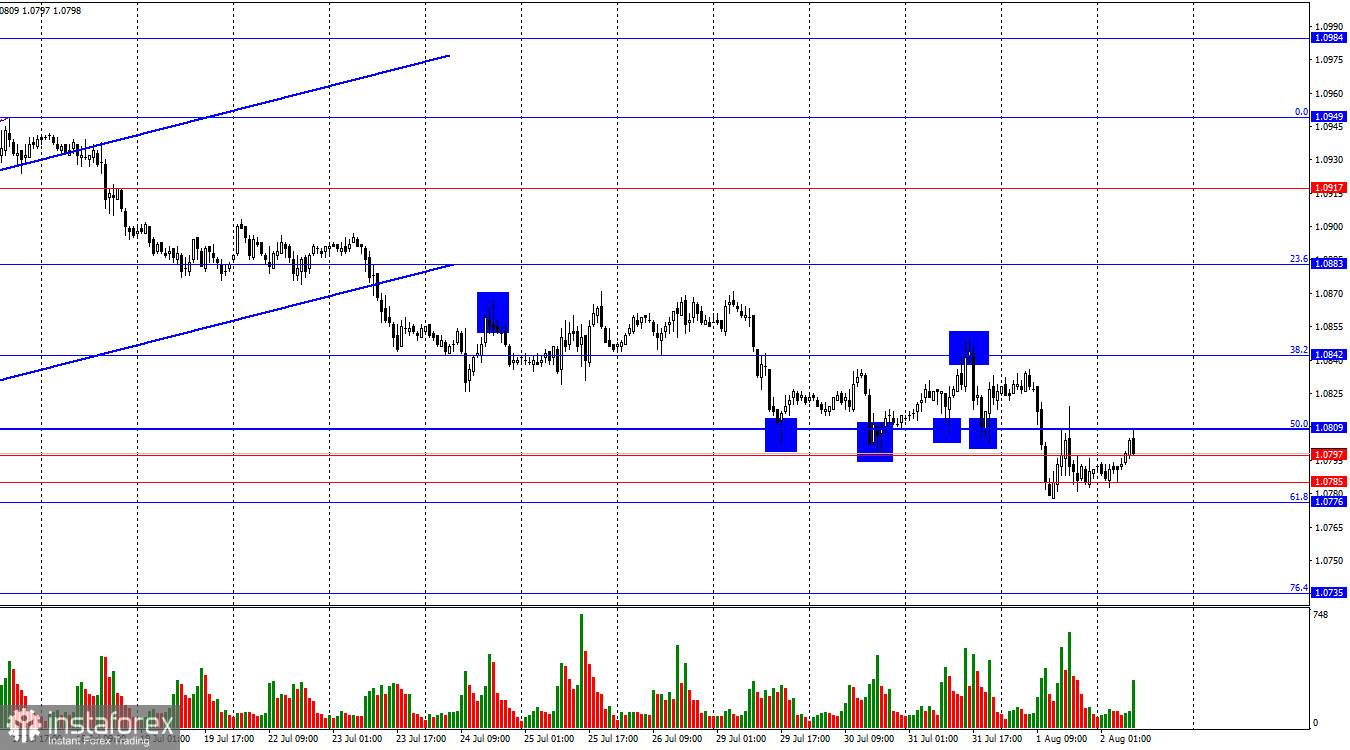
On Thursday, the EUR/USD pair continued its decline but got stuck in the support zone of 1.0776–1.0809. As I warned yesterday, it will be difficult for the bears to break this zone, at least on the first attempt. Today, they will have an opportunity if the American reports meet traders' expectations. Otherwise, the pair may rebound to the 38.2% retracement level at 1.0842 and try again to consolidate below the 1.0776–1.0809 zone.
The situation with the waves has become more complicated, but overall, it is not problematic. The last upward wave surpassed the peak of the previous wave and can be considered complete. Thus, the bears have started forming a corrective wave. For the "bullish" trend to reverse, bears need to breach the previous downward wave's low, which is around 1.0668. To achieve this, they need to move down another 150-180 points. Given the current trader activity, achieving this may take another 2-3 weeks. The current rate of decline cannot be considered rapid.
On Thursday, the news background did not allow the dollar to strengthen significantly, nor did it suggest a significant rise in the euro. The unemployment rate in the EU rose to 6.5%, which traders did not expect (a dollar factor), and the ISM manufacturing index turned out to be worse than expected—46.8 against 48.8 (a factor in favor of the euro). If the Bank of England had not decided to start easing monetary policy during their meeting, we likely would not have observed any market movements that day. It is important to note that the bears have been active in recent weeks, but their activity, like the overall market activity, is very weak. Therefore, one or several days without movements is normal at this time. Today, the dollar faces a test in the labor market and unemployment. Since the start of the day, the bears have been trying to close below the 1.0776 level even before this data was released. So, they are optimistically inclined.
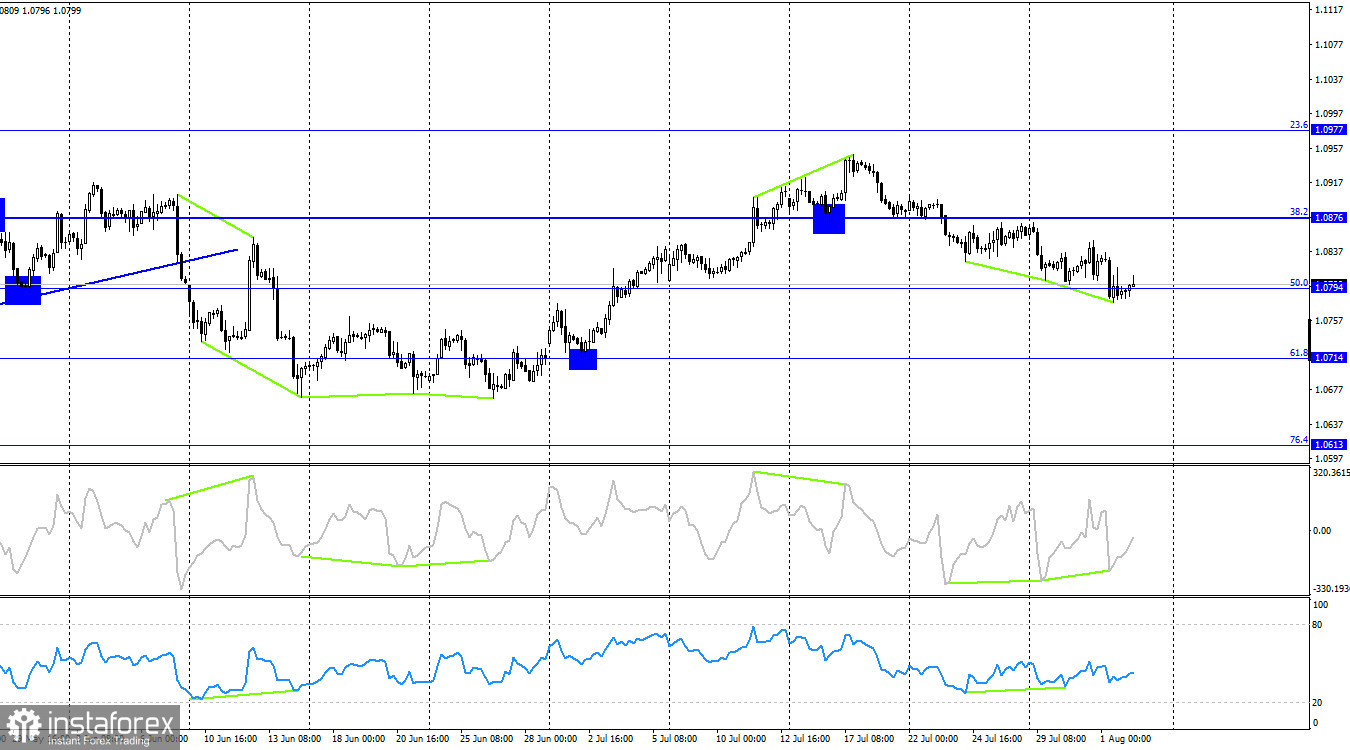
On the 4-hour chart, the pair declined to the 38.2% retracement level at 1.0876. Consolidation of the pair's course below this level will increase the likelihood of further falling towards the next Fibonacci level of 61.8%—1.0714, despite two "bullish" divergences at the CCI indicator. Buying signals (if there are any) should be looked for on the hourly chart.
Commitments of Traders (COT) Report
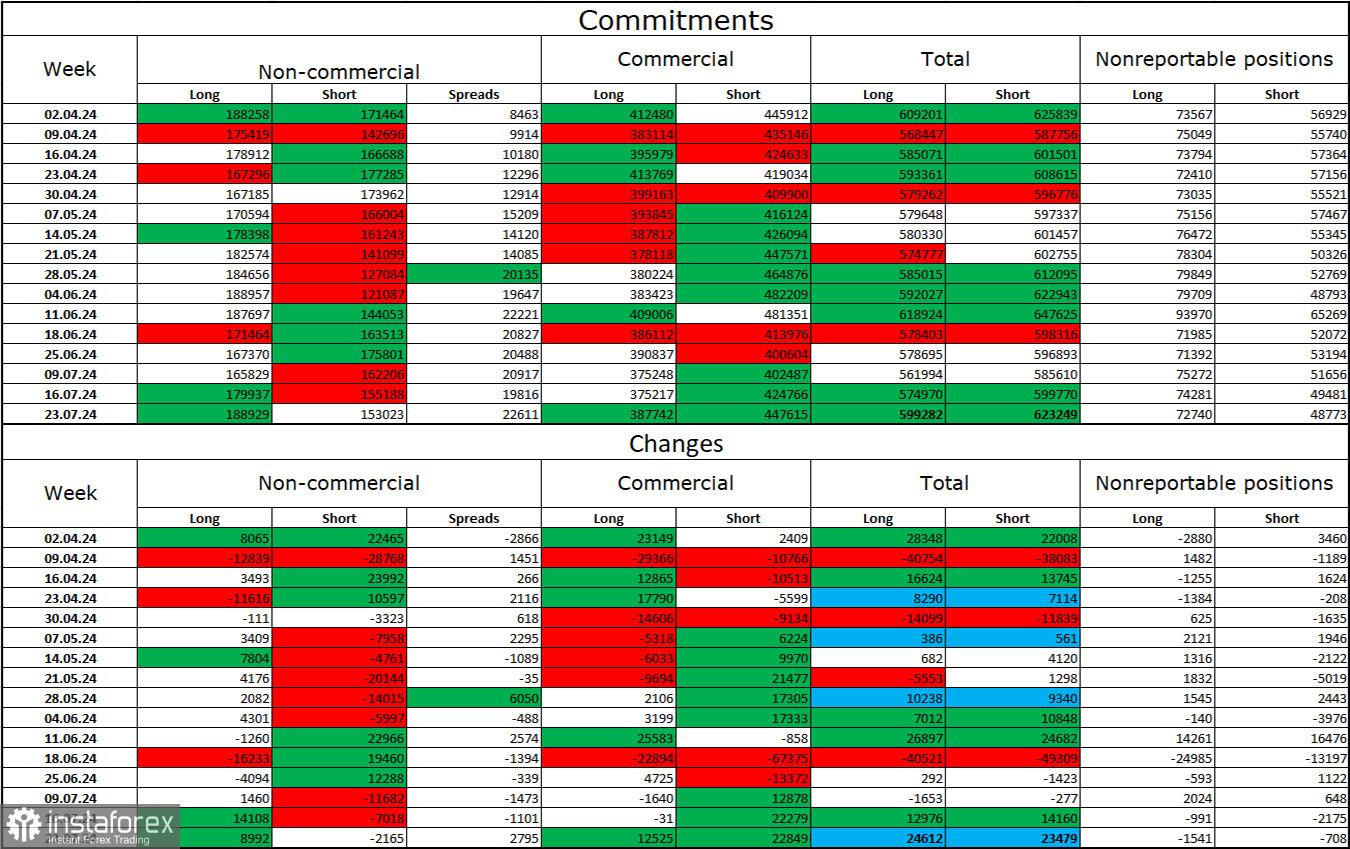
Over the last reporting week, speculators opened 8,992 long positions and closed 2,165 short positions. The mood of the "Non-commercial" group changed to "bearish" a couple of months ago, but at this time, bulls once again dominate. The total number of long positions held by speculators now stands at 189,000, while short contracts are at 153,000.
The situation will continue to change in favor of the bears. I see no long-term reasons to buy the euro, as the ECB has begun easing monetary policy, which will lower the yield on bank deposits and government bonds. In America, however, they will remain high for several more months, making the dollar more attractive to investors. The potential for the euro to decline, even according to COT reports, looks impressive. However, one should remember graphic analysis, which currently does not allow for the confident prediction of a strong fall in the euro currency.
News Calendar for the USA and the European Union
- USA – Changes in Nonfarm Payrolls employment numbers (12-30 UTC).
- USA – Unemployment rate (12-30 UTC).
- USA – Changes in average earnings (12-30 UTC).
On August 2, the economic events calendar again contains several important entries. The impact of today's news on market sentiment may once again be significant.
EUR/USD Forecast and Trader Tips
Sales of the pair were possible with a rebound from the 1.0842 level on the hourly chart with a target of 1.0809. This target has been reached. The pair's fall can be continued, but at the bottom of the hourly chart, there are too many levels that may prove too tough for the bears. A rebound from the 1.0809 level allows looking more toward new sales.
Fibonacci grids are built from 1.0668–1.0949 on the hourly chart and from 1.0450–1.1139 on the 4-hour chart.


