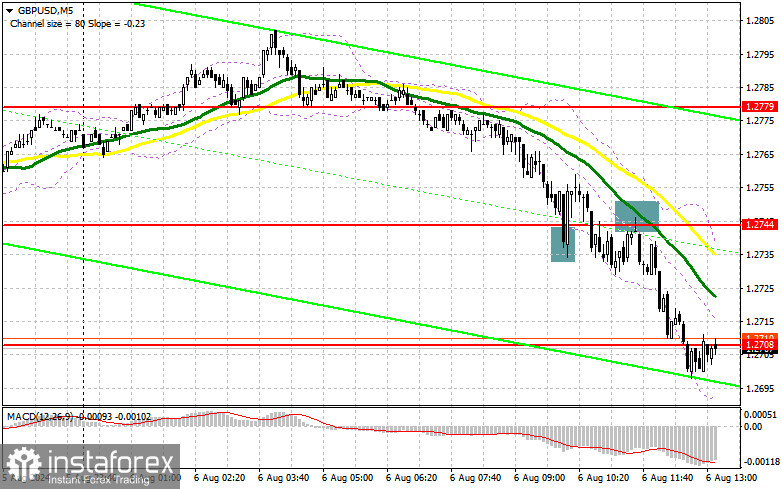
In my morning forecast, I focused on the level of 1.2744 and planned to make market entry decisions from it. Let's look at the 5-minute chart and see what happened there. The decline and the formation of a false breakout at 1.2744 allowed for market entry, but a significant rise in the pair did not occur. After some time, a breakout and retest of 1.2744 provided a suitable entry point for selling GBP/USD, which resulted in the pair falling by more than 40 points. The technical picture for the second half of the day was slightly revised.

To open long positions on GBP/USD, it is necessary:
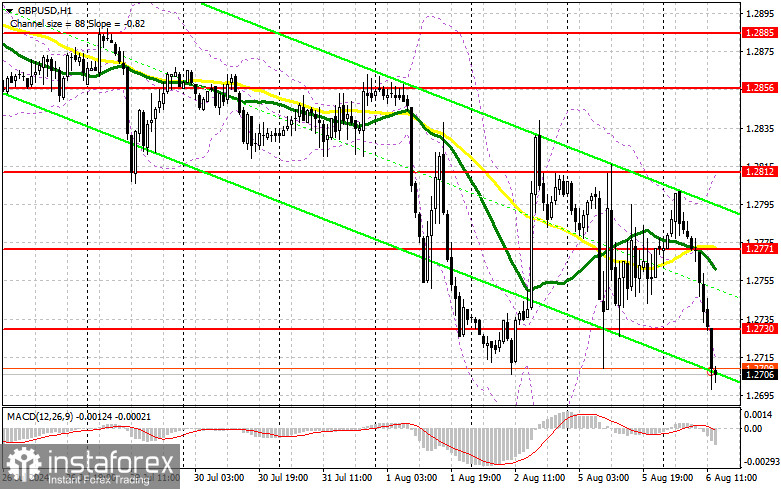
The pound still has issues, as I mentioned in my morning forecast. Breaking the weekly low without active buyer intervention suggests a further decline in the pair, so be cautious with long positions. Ahead are data on the U.S. trade balance and the RCM/TIPP economic optimism index. Whether they will impact the pound is very possible, although there are significant doubts. Therefore, only a decline and the formation of a false breakout near the nearest support at 1.2681 will be a suitable option for opening long positions in anticipation of a correction to the new resistance at 1.2730, formed by the results of the first half of the day. A breakout and retest from top to bottom of this range will return the chances for a correction in the pound, leading to an entry point for long positions with the possibility of reaching the level of 1.2771, where moving averages are positioned, favoring sellers. The furthest target will be the area of 1.2812, where I intend to take profits. If the scenario of further decline in GBP/USD continues and there is no activity from the bulls at 1.2681 in the second half of the day, the pound's condition will worsen significantly. This will lead to a decline and an update of the next support at 1.2640, increasing the chances of a more significant drop in the pair. Therefore, only the formation of a false breakout will be a suitable condition for opening long positions. I plan to buy GBP/USD immediately on a rebound from the low of 1.2613 with a target of a correction of 30-35 points within the day.
To open short positions on GBP/USD, it is necessary:
Sellers have regained control of the market and all that remains is to maintain it. In case of a positive reaction to the data for the pound, forming a false breakout in the area of new resistance at 1.2730 will provide an opportunity to open new short positions. This will continue the bearish trend with the target of updating a new weekly low and support at 1.2681, where the pair is currently headed. A breakout and retest from the bottom to the top of this range will strike at the positions of buyers, leading to the clearance of stop orders and opening the way to 1.2640. The furthest target will be the area of 1.2613, where I will take profits. Testing this level will only strengthen the new bearish trend. In the event of an upward movement of GBP/USD and the absence of activity at 1.2730 in the second half of the day, buyers will have a good chance to recover losses and restore the pound by the end of the day to more acceptable levels to preserve the chance for growth. In such a case, I will delay sales until a false breakout at the level of 1.2771. In the absence of downward movement, I will sell GBP/USD immediately on a rebound from 1.2812, but only in anticipation of a correction of the pair downward by 30-35 points within the day.

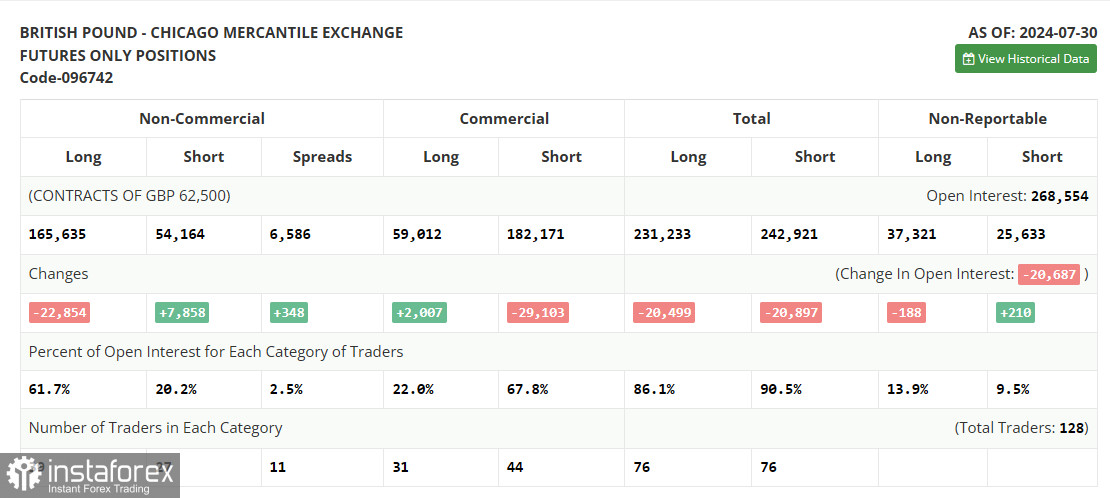
In the COT report (Commitment of Traders) for July 30, there was an increase in short positions and a reduction in long ones. This change in positioning is not surprising, as the results of the Bank of England meeting made it clear that it intends to further lower interest rates, since the economy now, more than ever after addressing inflation, requires special support. The Federal Reserve's decision to leave interest rates unchanged, in contrast to the Bank of England, resulted in a drop in the pound, which is likely to persist in the near future. The latest COT report states that long non-commercial positions fell by 22,854 to 165,635, while short non-commercial positions increased by 7,858 to 54,164. As a result, the spread between long and short positions increased by 348.
Indicator signals:
Moving averages
Trading is conducted below the 30 and 50-day moving averages, indicating a further decline in the pair.
Note: The period and prices of the moving averages are considered by the author on the H1 hourly chart and differ from the general definition of classic daily moving averages on the D1 daily chart.
Bollinger Bands
In case of a decrease, the lower border of the indicator around 1.2710 will act as support.
Indicator descriptions:
- Moving average (smooths volatility and noise to determine the current trend). Period 50. Marked in yellow on the chart.
- Moving average (smooths volatility and noise to determine the current trend). Period 30. Marked in green on the chart.
- MACD (Moving Average Convergence/Divergence) Fast EMA period 12. Slow EMA period 26. SMA period 9
- Bollinger Bands. Period 20
- Non-commercial traders are speculators such as individual traders, hedge funds, and large institutions that use the futures market for speculative purposes and meet certain requirements.
- Long non-commercial positions represent the total long open position of non-commercial traders.
- Short non-commercial positions represent the total short open position of non-commercial traders.
- Total non-commercial net position is the difference between short and long positions of non-commercial traders.


