Analysis of GBP/USD 5M

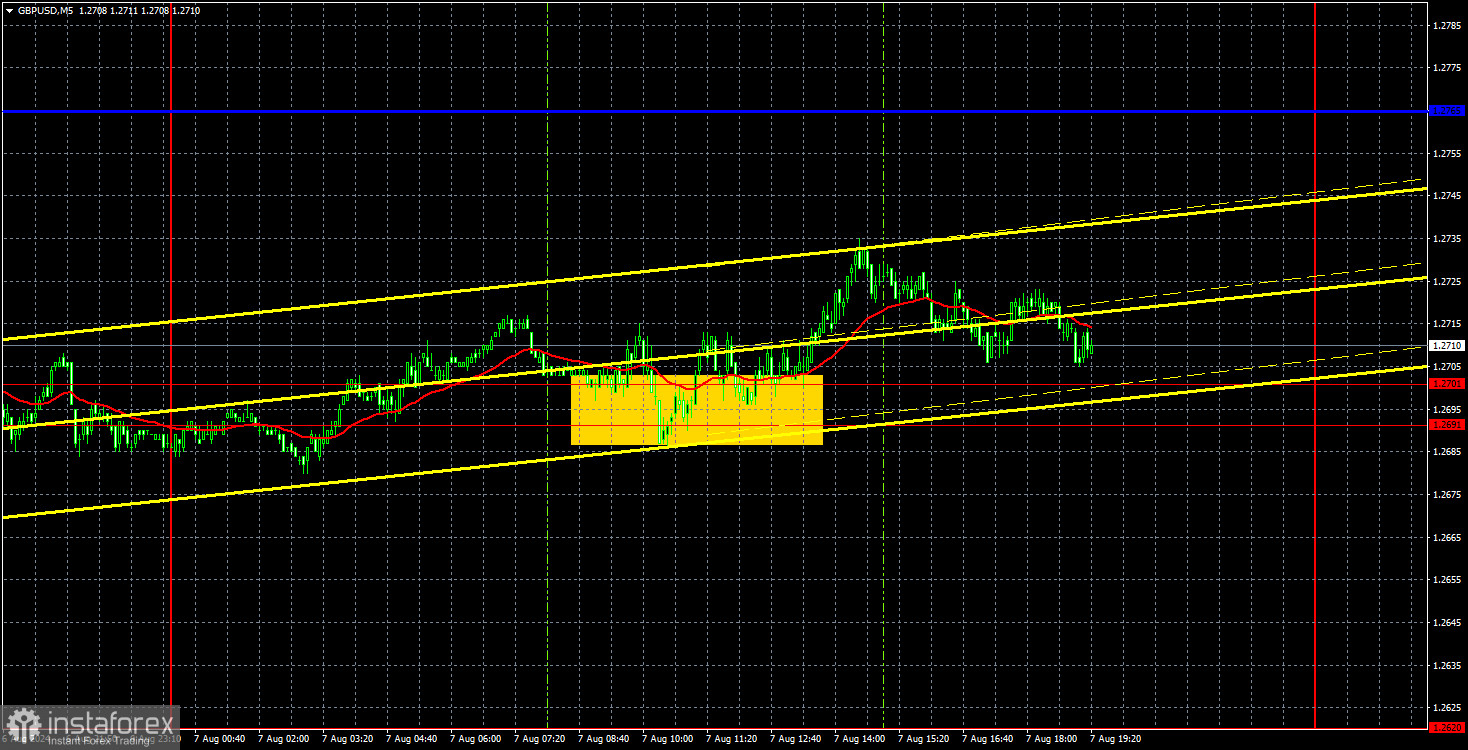
On Wednesday, the GBP/USD pair traded at much lower volatility than in recent days. It failed to break through the 1.2691-1.2701 area, so, as we warned, an upward correction is now possible aimed at the downward trend line. The correction could be stronger, considering the general trend of the dollar falling in 2024.
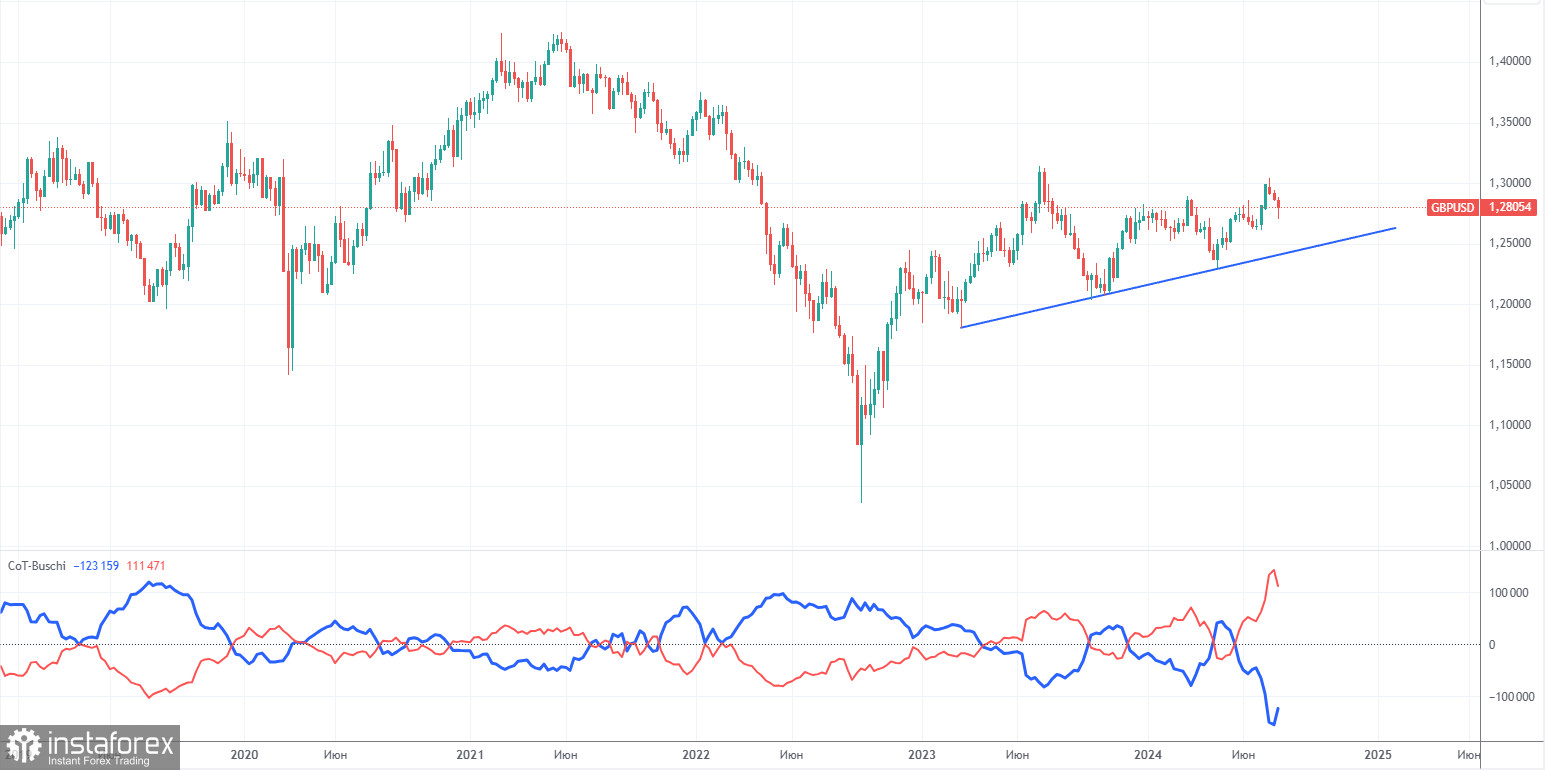
There were no significant events, reports, or speeches in the United Kingdom or the United States. The market had nothing to react to. The 24-hour timeframe clearly shows that the price has once again corrected within an upward trend, which is, in fact, a correction. In the long term, the British currency continues to edge higher, and the market still clings to any excuse to continue buying pounds and selling dollars. It is quite possible that the decline of the British currency will end very quickly this time, too. The market has a reasonable justification for buying – the Federal Reserve will lower the key rate by 100-150 points by the end of the year. And it doesn't matter whether this is true or not.
The pair's movements yesterday were chaotic and sluggish in the 5-minute time frame. The price bounced off the 1.2691-1.2701 area at one point and even rose about 25 pips. But the volatility of the past was gone. By evening, the price had returned to the 1.2691-1.2701 area.
COT report:

COT reports for the British pound indicate that the sentiment among commercial traders has been constantly changing in recent years. The red and blue lines, representing the net positions of commercial and non-commercial traders, constantly intersect and are often close to the zero mark. According to the latest report on the British pound, the non-commercial group closed 22,800 buy contracts and opened 7,800 short ones. As a result, the net position of non-commercial traders decreased by 30,600 contracts over the week. But the buyers still have a considerable advantage.
The fundamental background still does not provide any grounds for long-term purchases of the pound sterling, and the currency has a real chance to resume the global downward trend. However, an ascending trend line formed in the 24-hour timeframe. Therefore, unless the price breaches this trend line, a long-term decline in the pound is not expected. The pound is rising despite almost everything, but even the COT reports show that major players are happily buying it.
The non-commercial group currently holds 165,600 buy contracts and 54,100 sell contracts. However, apart from COT reports, nothing else indicates potential growth in the GBP/USD pair. Such a strong buyer's advantage suggests a possible trend change.
Analysis of GBP/USD 1H

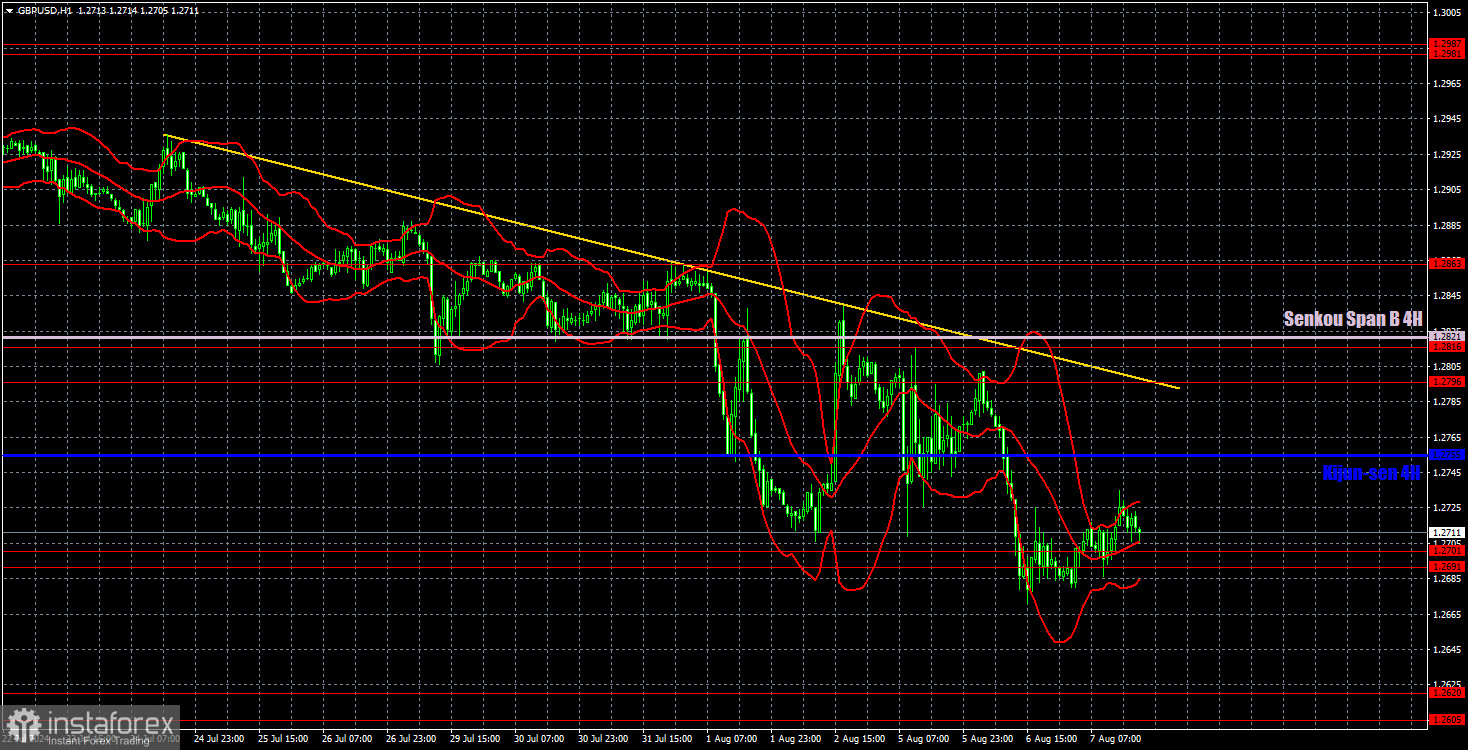
In the hourly chart, GBP/USD has a real chance to sustain its decline, but a correction could start soon. This is the only logical and consistent scenario when considering all factors: technical, fundamental, and macroeconomic. However, the market may again begin using any excuse to sell the dollar. And there are now reasons for that. The US data on the labor market and unemployment were again weaker than forecasts, and the market now expects the Fed to cut rates by 0.5% in September.
For August 8, we highlight the following important levels: 1.2269, 1.2349, 1.2429-1.2445, 1.2516, 1.2605-1.2620, 1.2691-1.2701, 1.2796-1.2816, 1.2863, 1.2981-1.2987, 1.3050. The Senkou Span B (1.2821) and Kijun-sen (1.2755) lines can also serve as sources of signals. Setting the Stop Loss to break even when the price moves in the intended direction by 20 pips is recommended. The Ichimoku indicator lines may shift during the day, which should be considered when determining trading signals.
On Thursday, no macroeconomic events are scheduled again in the UK and the US. Thus, volatility may remain low, and the price may continue to correct upwards. Talking about a more substantial and prolonged rise in the British pound will only be possible after breaking the trend line.
Explanation of illustrations:
Support and resistance levels: Thick red lines near which the trend may end.
Kijun-sen and Senkou Span B lines: These Ichimoku indicator lines, transferred from the 4-hour timeframe to the hourly chart, are strong lines.
Extreme levels: Thin red lines from which the price previously bounced. These provide trading signals.
Yellow lines: Trend lines, trend channels, and other technical patterns.
Indicator 1 on COT charts: The net position size for each category of traders.


