The GBP/USD pair continued to rise on Thursday. Some might say that the macroeconomic backdrop once again favored the British currency, and technically, they would be right. In the morning, reports on business activity in the services and manufacturing sectors were published in the UK, which exceeded expert forecasts. Isn't that a good reason for more purchases of the pound? To some, this movement seems logical. But we'd like to ask a simple question: What if, over the next year, all reports from the UK are stronger than forecasts, and those from the US are weaker? Would the GBP/USD pair rise to 1.5? To 1.7?
We want to point out that while reports are important, they are not the sole factor. Yes, there should be a reaction to them, but typically, this reaction occurs because of discrepancies between actual figures and forecasts. In other words, the market reacts not to changes in the economy but to discrepancies from its expectations.
This raises the question: What if expectations for British data are always understated, and those for American data are always overstated? Will the British currency rise indefinitely? We've highlighted a crucial point: In recent months, when the Federal Reserve's rate has remained at its peak, experts did not anticipate a slowdown in inflation or a drop in major macroeconomic indicators. This creates a situation where the American economy is expected to deliver exceptionally high figures while the Fed is expected to lower rates. But clearly, under the most hawkish monetary policy in decades, economic indicators cannot keep rising!
Thus, we argue that the problem with the dollar is not due to weak data from the US or the Fed's monetary policy. The data aren't weak, and monetary policy hasn't been eased yet. So why is the dollar falling? At the same time, the Bank of England is easing, and macroeconomic indicators in the UK are certainly not better than in the US (for the most part). The market is responding to its expectations and desires. And this isn't just about ordinary retail and private traders. This concerns the major players who drive the market.
On Wednesday evening, another Fed meeting minutes was published, which could be interpreted in any direction. And that's precisely what the market did. Even though it contained no direct hints about a rate cut in September, the market deemed it dovish and continued to sell the US dollar. In other words, a scenario unlikely to occur for the past eight months continues to be acted upon by the market almost daily. If anyone sees sacred meaning and logic in this, we are very envious of them.
As a result, the British currency continues to rise, and today, the dollar might fall even further. Even though Powell's speech has been priced in by the market about five times already, why not take advantage of a new reason to buy GBP/USD?

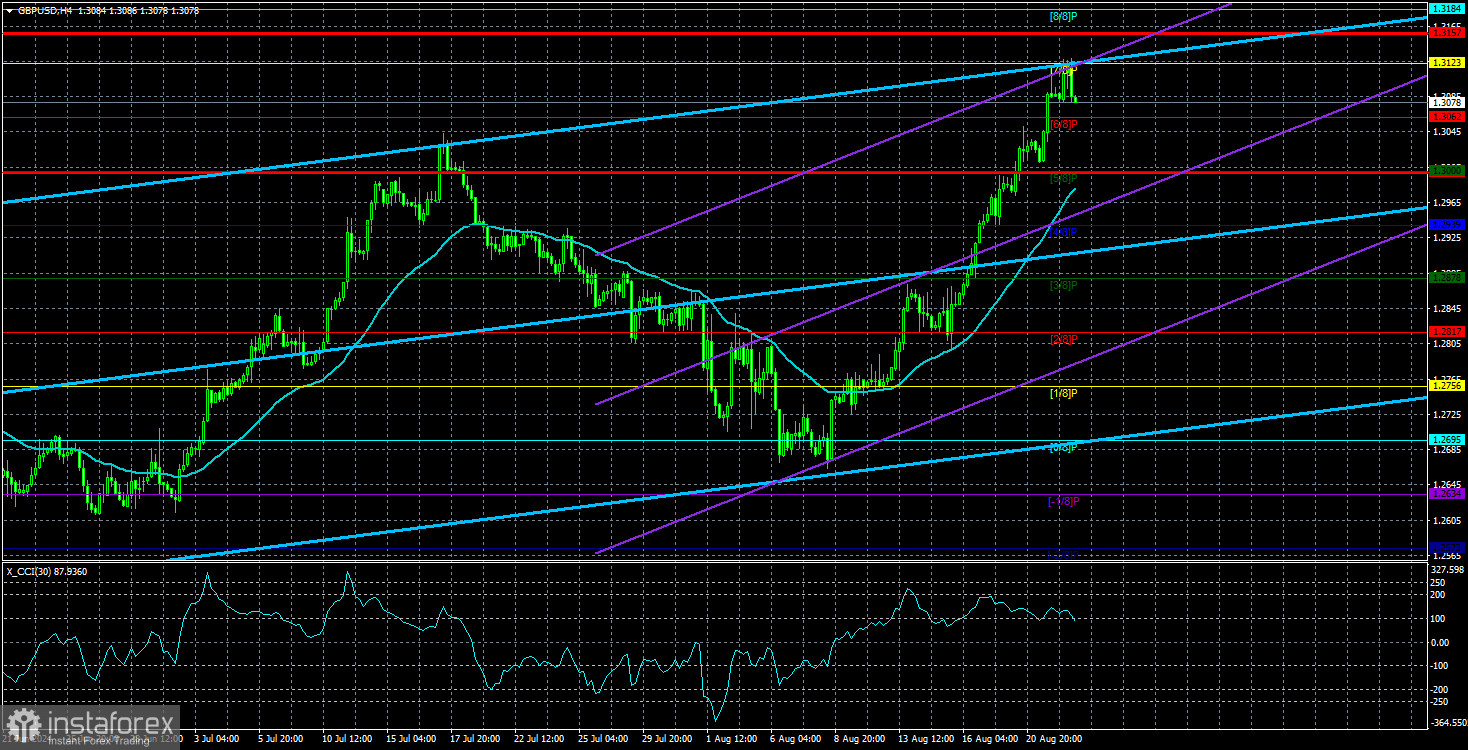
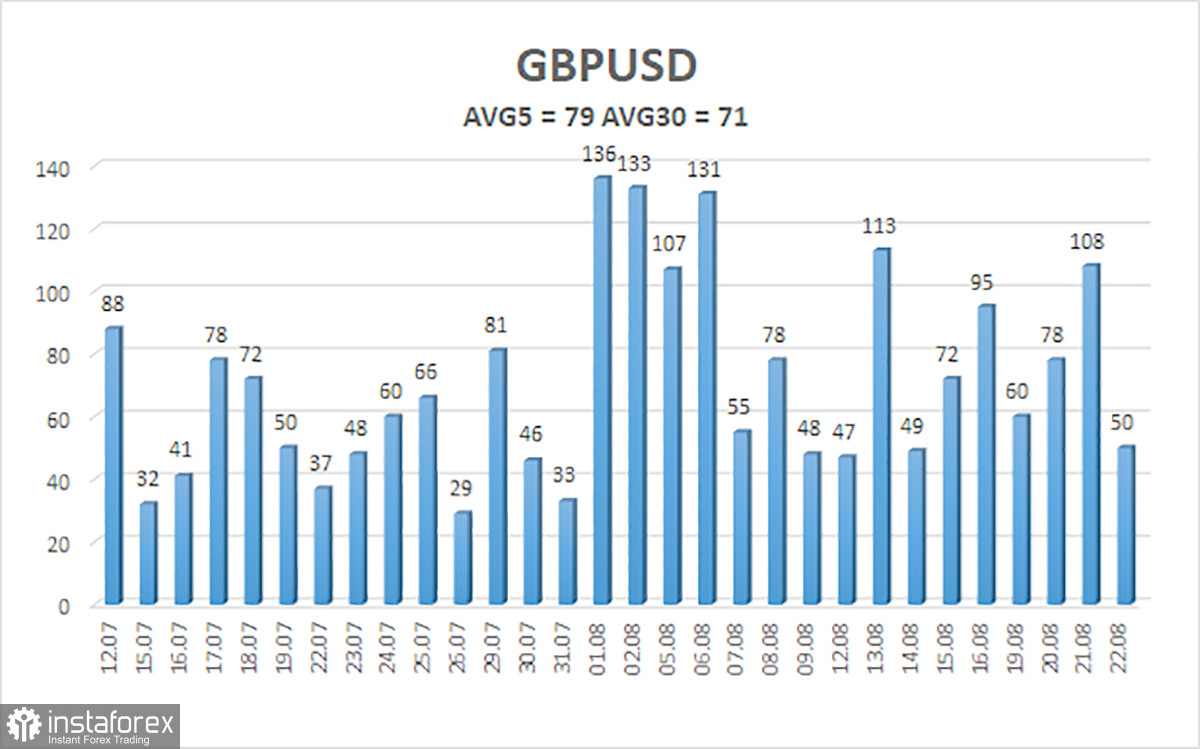
The average volatility of the GBP/USD pair over the past five trading days is 79 pips. For the GBP/USD pair, this value is considered average. On Friday, August 23, we expect movement within the range bounded by levels 1.2999 and 1.3157. The upper channel of the linear regression is directed upwards, signaling the continuation of the uptrend. The CCI indicator may soon enter the overbought zone again and has already formed a bearish divergence.
Nearest Support Levels:
- S1 – 1.3062
- S2 – 1.3000
- S3 – 1.2939
Nearest Resistance Levels:
- R1 – 1.3123
- R2 – 1.3184
- R3 – 1.3245
Trading Recommendations:
The GBP/USD pair continues its illogical rise but retains a good chance of resuming a downward momentum. We are not considering long positions at this time, as we believe that the market has already addressed all the bullish factors for the British currency (which are not much) several times. The market continues to buy without any apparent reason. Short positions could be considered at least after the price settles below the moving average, with targets at 1.2939 and 1.2878. The current movement of the pair has nothing to do with the concepts of "logic" and "regularity."
Explanations for Illustrations:
Linear Regression Channels: help determine the current trend. If both are directed in the same direction, it means the trend is strong.
Moving Average Line (settings 20,0, smoothed): determines the short-term trend and the direction in which trading should be conducted.
Murray Levels: target levels for movements and corrections.
Volatility Levels (red lines): the probable price channel in which the pair will spend the next 24 hours, based on current volatility indicators.
CCI Indicator: Entering the oversold area (below 250) or the overbought area (above +250) means a trend reversal is approaching.


