On Friday, the GBP/USD pair witnessed a significant surge, with the British pound gaining over 120 pips. Naturally, this increase in the British currency was linked to Federal Reserve Chair Jerome Powell's speech and market expectations for a rate cut by the U.S. central bank in September and beyond. Having previously examined the EUR/USD price movement prospects, we now turn our attention to a similar analysis for GBP/USD.
Let's start with the weekly time frame. In September 2022, the GBP/USD exchange rate fell to 1.0400, an all-time low. In July 2022, U.S. inflation began to decrease, and the market anticipated a forthcoming rate cut. In other words, it started to price in the expected monetary policy easing in advance. Of course, we must also consider factors directly affecting the British pound, such as Brexit, the pandemic, the failed tenure of Liz Truss, and the general deterioration of the British economy. Thus, it is possible that the British pound initially fell too low, anticipating a subsequent recovery. After all, Liz Truss resigned, the economy stabilized, the pandemic ended, and Britain began to adapt to life outside the EU. However, we cannot ignore that the U.S. dollar also started to decline, as it was falling against the euro at the same time, which did not face the same issues as the British pound mentioned above.
Therefore, we can confidently assume that the British pound's rise is due to recovery from a series of calamities and to the decline in U.S. inflation. Currently, it is rising because the market is still anticipating rate cuts in the U.S. and has been pricing this factor for two years. Some analysts link the pound's rise to the shift to a Labour government. Others believe that increased risk appetite in the market is driving the pound's rise. We do not support these viewpoints. No one knows how the Labour government under Keir Starmer will perform, and rising risk sentiment can constantly shift to anti-risk sentiment amidst numerous geopolitical conflicts worldwide.
Thus, we cannot expect further growth from the pound, but paradoxically, the pound may continue to rise. The growth may persist simply because market makers continue to buy the pound based on their trading strategies. From our perspective, the best approach for traders would be to wait until the market makers end the baseless trend and then anticipate a substantial decline in the British pound and trade it accordingly, as such a movement would be entirely logical and expected. If traders wish to capitalize on the current rise in the pair, they should rely solely on technical analysis. However, even technical analysis warns of a likely end to the upward trend.

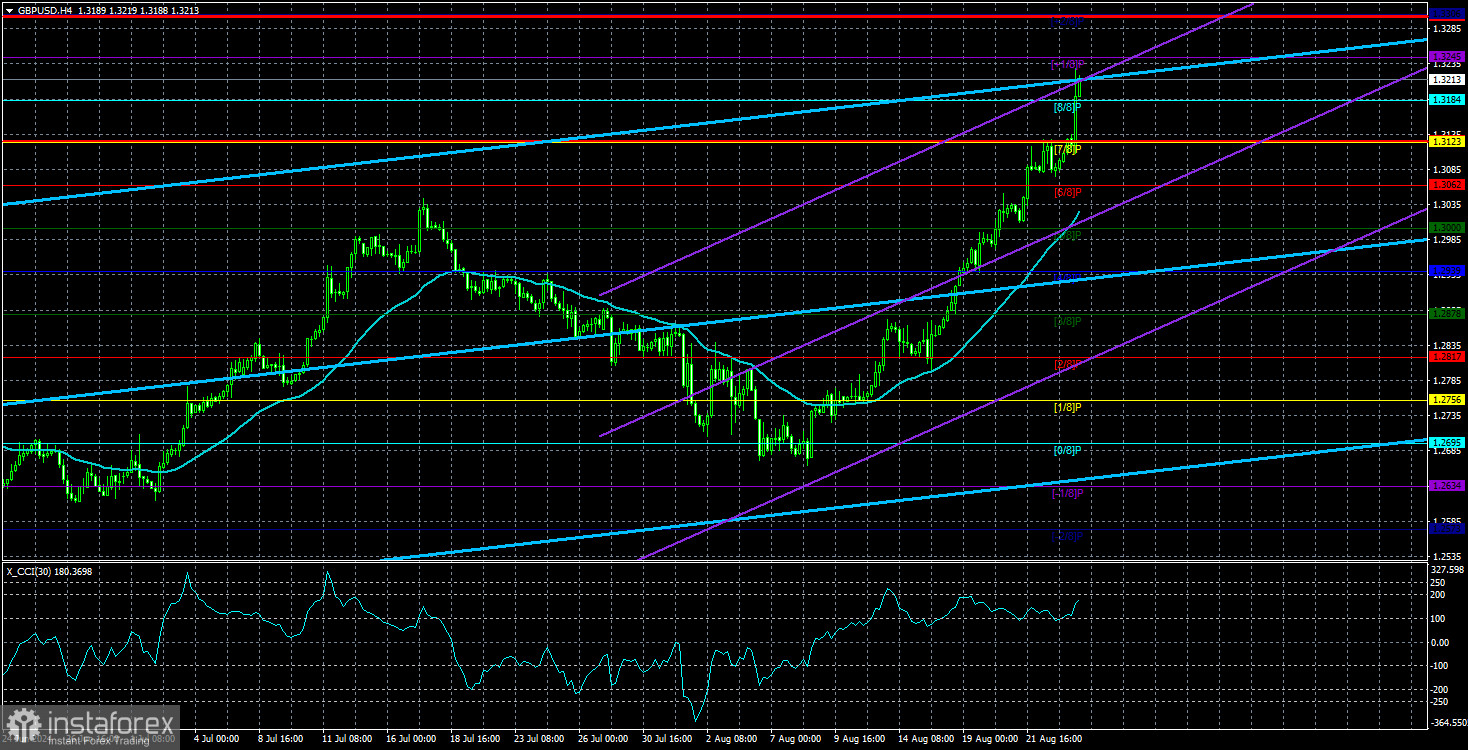
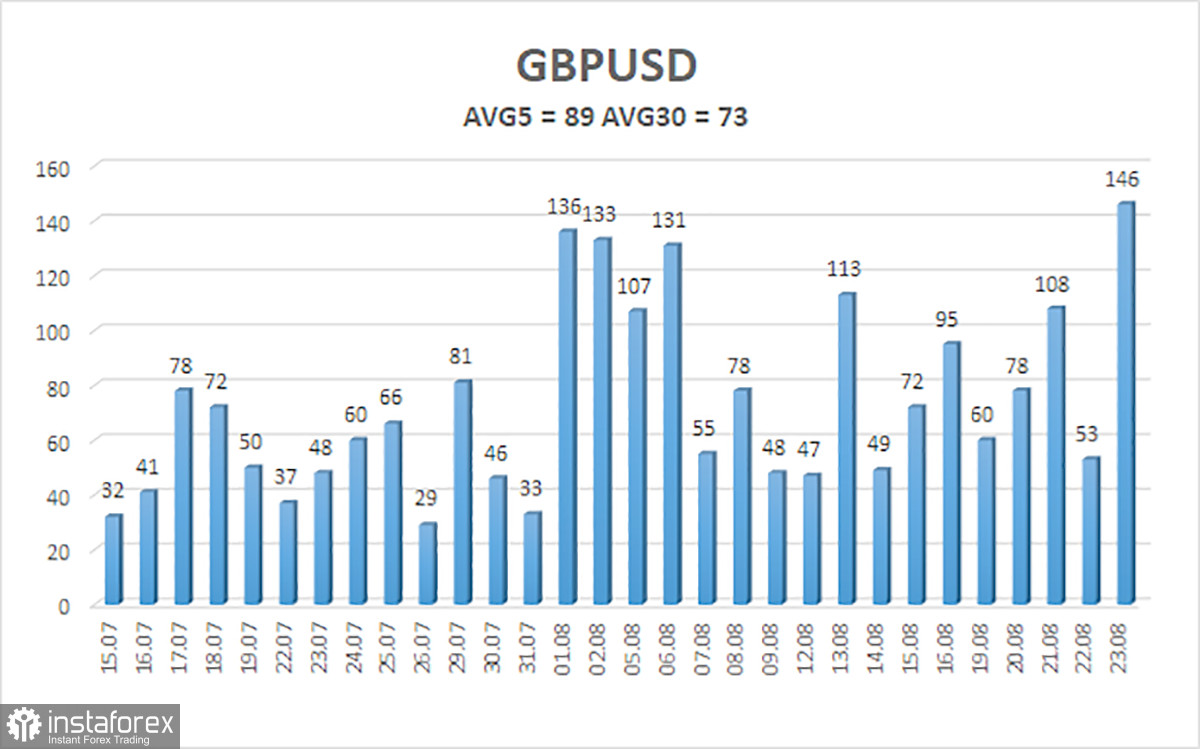
The average volatility of the GBP/USD pair over the past five trading days is 89 pips. For the GBP/USD pair, this value is considered "average." On Monday, August 26, we expect movement within the range bounded by levels 1.3124 and 1.3302. The upper channel of the linear regression is directed upwards, signaling the continuation of the uptrend. The CCI indicator may soon enter the overbought zone again and has already formed a triple bearish divergence.
Nearest Support Levels:
- S1 – 1.3184
- S2 – 1.3123
- S3 – 1.3062
Nearest Resistance Levels:
- R1 – 1.3245
- R2 – 1.3306
Trading Recommendations:
The GBP/USD pair continues its illogical rise but retains a good chance of resuming a downward momentum. We are not considering long positions at this time, as we believe that the market has already addressed all the bullish factors for the British currency (which are not much) several times. The market continues to buy without any apparent reason. Short positions could be considered at least after the price settles below the moving average, with targets at 1.2939 and 1.2878. The current movement of the pair has nothing to do with the concepts of "logic" and "regularity."
Explanations for Illustrations:
Linear Regression Channels: help determine the current trend. If both are directed in the same direction, it means the trend is strong.
Moving Average Line (settings 20,0, smoothed): determines the short-term trend and the direction in which trading should be conducted.
Murray Levels: target levels for movements and corrections.
Volatility Levels (red lines): the probable price channel in which the pair will spend the next 24 hours, based on current volatility indicators.
CCI Indicator: Entering the oversold area (below 250) or the overbought area (above +250) means a trend reversal is approaching.


