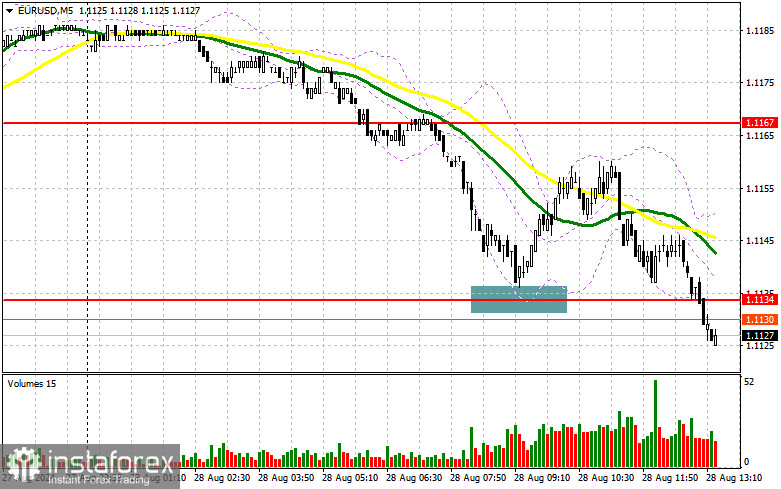
In my morning forecast, I focused on the 1.1134 level and planned to make market entry decisions based on it. Let's look at the 5-minute chart and analyze what happened. The decline occurred, but it did not reach the point of testing and forming a false breakout at this level. As a result, I missed the much-anticipated euro rebound during the European session, which I detailed in my morning forecast. The technical picture for the second half of the day has been slightly revised.

To open long positions on EUR/USD:
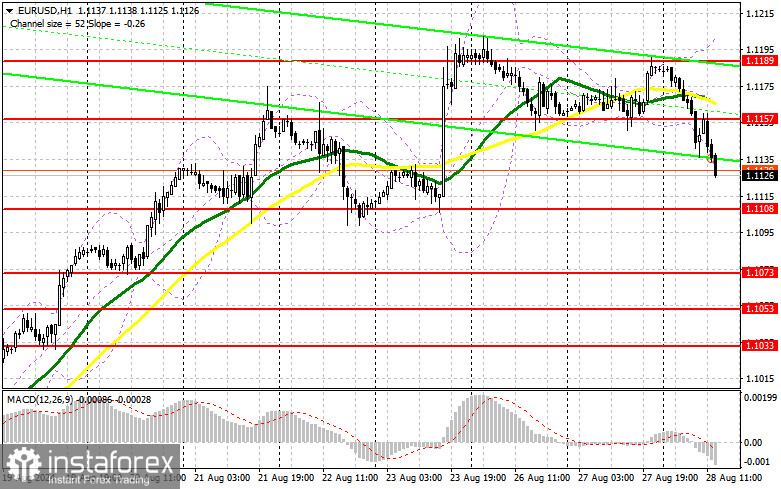
It may happen that in the absence of significant U.S. fundamental statistics, the euro will continue its decline, leading to a more substantial correction, fully offsetting the gains made last Friday after Fed Chairman Jerome Powell's speech. For this reason, I won't rush into buying. It's better to wait for a drop and the formation of a false breakout around the 1.1108 support level, towards which the pair is currently heading. Only this will create a suitable condition for opening long positions in anticipation of euro growth and a retest of the new resistance at 1.1157, formed in the first half of the day. The moving averages, which favor sellers, are also located there. A breakout and subsequent retest of this range from top to bottom will lead to an upward movement of the pair, with a chance to test 1.1189. The ultimate target will be the 1.1237 high, where I will take profit. If EUR/USD declines and there is no activity around 1.1108 in the second half of the day, sellers will strengthen their positions and gain a chance for a more significant correction. In this case, I will only enter the market after a false breakout around the next support at 1.1073. I plan to open long positions immediately on a rebound from 1.1053, targeting an intraday correction of 30-35 points.
To open short positions on EUR/USD:
Sellers made their presence felt after the Asian session, indicating a real increase in investor aversion to risk assets. We'll see how the pair performs during the U.S. session, but a rise and a false breakout around the new resistance at 1.1157 would be a suitable scenario for opening new short positions to continue the bearish trend, targeting a retest of the 1.1108 support. I expect the first signs of significant buyers to appear there. A breakout and consolidation below this range, followed by a retest from below, will provide another selling point, aiming for a move towards 1.1073. The ultimate target will be the 1.1053 level, where I will take profit. If EUR/USD rises against the backdrop of no US statistics and no bears at 1.1157, which is possible, buyers will regain the initiative, getting a chance to update the monthly high and push the pair further upwards. In this case, I will postpone selling until the next resistance at 1.1189 is tested. I will also sell there but only after a failed consolidation. I plan to open short positions immediately on a rebound from 1.1237, targeting a downward correction of 30-35 points.

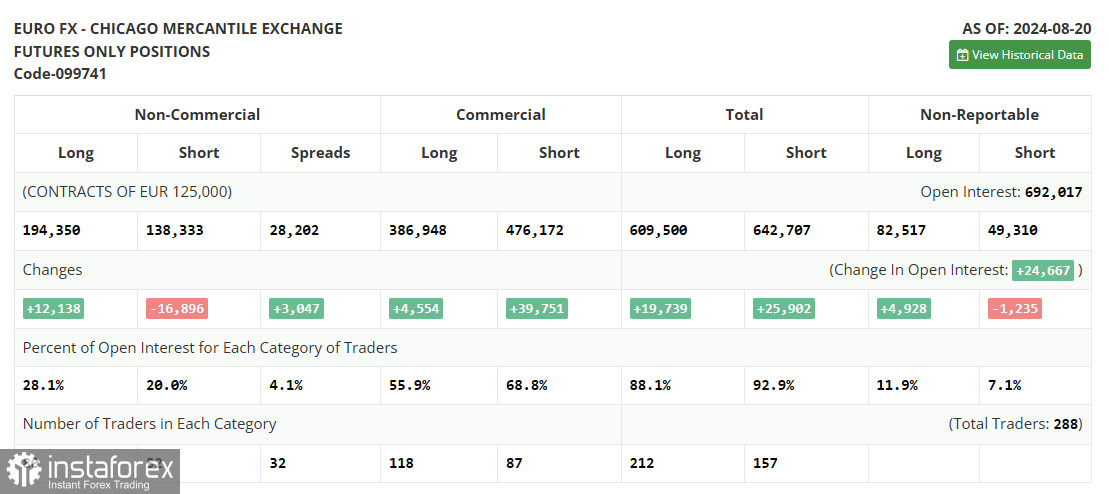
In the COT report (Commitment of Traders) for August 20, there was an increase in long positions and a significant reduction in short positions, indicating continued bullish sentiment among risk asset buyers. The recent speech by Fed Chairman Jerome Powell at Jackson Hole, which is not yet reflected in this report, will likely lead to an even greater shift in favor of euro buyers. However, the dollar's future direction will depend on incoming data related to U.S. inflation and the labor market. Therefore, I recommend paying close attention to these indicators. The COT report indicated that long non-commercial positions increased by 12,138 to 194,350, while short non-commercial positions fell by 16,896 to 138,333. As a result, the gap between long and short positions increased by 3,047.
Indicator Signals:
Moving Averages
Trading is occurring below the 30 and 50-day moving averages, indicating a possible decline in the euro.
Note: The period and prices of moving averages are considered by the author on the H1 hourly chart and differ from the general definition of classic daily moving averages on the D1 daily chart.
Bollinger Bands
If a decline occurs, the lower boundary of the indicator around 1.1130 will act as support.
Description of Indicators:
- Moving Average: Determines the current trend by smoothing out volatility and noise. Period – 50. Marked in yellow on the chart.
- Moving Average: Determines the current trend by smoothing out volatility and noise. Period – 30. Marked in green on the chart.
- MACD Indicator (Moving Average Convergence/Divergence): Fast EMA – period 12. Slow EMA – period 26. SMA – period 9.
- Bollinger Bands: Period – 20.
- Non-commercial traders: Traders such as individual traders, hedge funds, and large institutions that use the futures market for speculative purposes and meet certain requirements.
- Long non-commercial positions: Represent the total long open position of non-commercial traders.
- Short non-commercial positions: Represent the total short open position of non-commercial traders.
- Total non-commercial net position: The difference between short and long positions of non-commercial traders.


