The wave structure for GBP/USD remains quite complex and highly ambiguous. At one point, the wave pattern looked convincing and suggested the formation of a downward wave set with targets below the 1.2300 level. However, in practice, demand for the U.S. dollar increased too much for this scenario to play out, and it continues to grow.
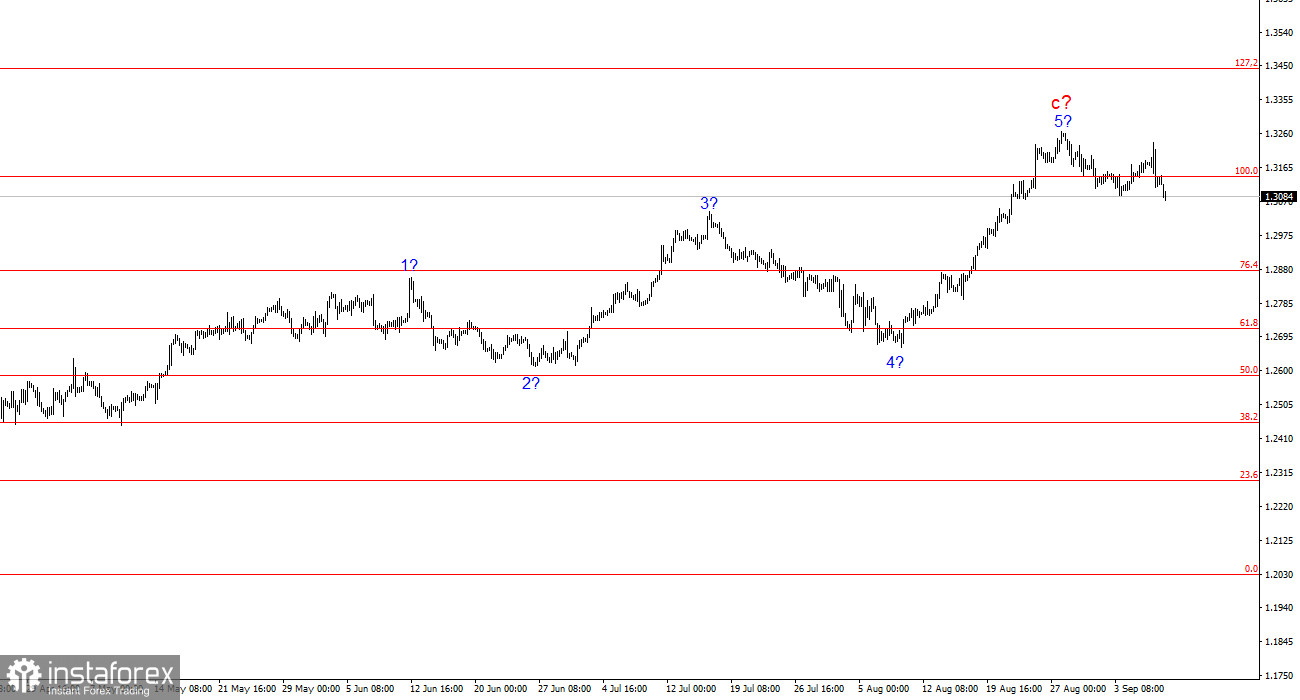
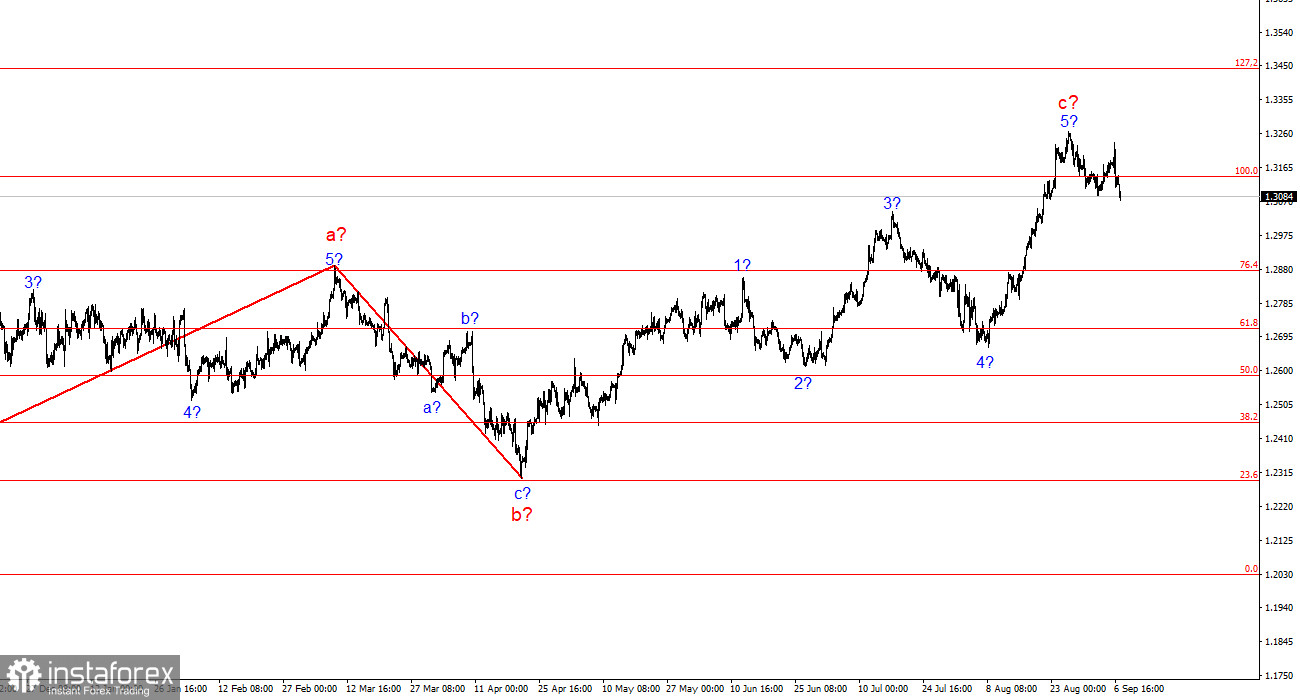
Currently, the wave structure has become very complicated. I should note that I try to use simple structures in my analysis since complex ones often come with too many nuances and uncertainties. We recently saw another upward wave, causing the pair to break out of the triangle. The current upward wave set, which likely began around April 22, could extend further, as the market doesn't seem to be calming down until it processes all phases of the Federal Reserve's rate cuts. A three-wave corrective structure seems to be forming again, and a successful attempt to break through the 1.3142 level (which corresponds to 100.0% Fibonacci) suggests the market is at least ready for a slight decline.
Sellers are struggling but not giving up. On Monday, the GBP/USD pair dropped by 35 basis points. Last week, the market received ample evidence that the U.S. labor market is going through tough times, but this was not unexpected. Over the past 4-5 months, mostly negative data has come from the U.S. However, this time, while the data was negative, it wasn't worse than the previous month. This suggests that while the situation remains challenging, no new deterioration has occurred, which is somewhat reassuring and indicates that the Fed may not need to intervene with a 50-point rate cut.
In light of this data, the market has lost confidence that a 50-basis-point cut is even possible. It was first discussed in early August when unemployment and labor market reports again showed weaker-than-expected results. However, expectations have since stabilized, with only a 30% chance of a 50-point cut. But the market had already priced in such a move, so now, not only is a corrective wave set needed, but also a reassessment of expectations. Regardless of the news, it cannot push the pair upwards indefinitely. A five-wave structure has now formed, so I expect a corrective wave set with targets around the 1.2800 level at a minimum. Reports from the UK due this week are unlikely to bring strong figures. I also doubt that U.S. inflation will slow more than to 2.6%. Even a 0.3% annual decline would be significant.
General Conclusions:
The wave structure for GBP/USD still suggests a decline. If an upward trend started on April 22, it has already taken on a five-wave form. Therefore, a minimum three-wave correction should now be expected. In my view, it is time to consider selling the pair with targets around the 1.2627 level. However, sellers have already failed to hold the 1.3142 level once, and the upward wave set could continue to extend indefinitely given the current news backdrop. Nonetheless, I expect a correction now.
On the higher wave scale, the wave pattern has transformed. We can now assume the formation of a complex and extended upward corrective structure. At this point, it's a three-wave structure, but it could evolve into a five-wave structure, which could take several more months, if not longer, to develop.
Key Principles of My Analysis:
- Wave structures should be simple and clear. Complex structures are hard to play out and often undergo changes.
- If you're uncertain about the market's direction, it's better to stay out of it.
- There is never 100% certainty in the direction of movement. Always use protective Stop Loss orders.
- Wave analysis can be combined with other types of analysis and trading strategies.


