The significant day has arrived — the European Central Bank has lowered its interest rate by 0.25% to 4.00%. Over the past three days, the U.S. stock index, the S&P 500, has been rising, and yesterday, oil prices increased as well. Meanwhile, the euro has been declining for five consecutive days. If we were to say that market participants are anticipating a rate cut, it would be a waste of time. Our point is different — despite the anticipation of the Federal Reserve's aggressive rate cut, the pace of the ECB's actual rate cut is likely to be quicker. Until today, ECB representatives have not given the market such an impression, but now it seems the time has come. However, this will be communicated indirectly through warnings about economic downturns and deflation risks. The Fed, meanwhile, will only need to reiterate that market expectations are inflated.
The reason for the increased pace of rate cuts lies not in the situation within Europe but in the U.S. approach to the dollar, as it must be maintained in a dominant position. Sanctions against countries moving away from the dollar in global trade have long been part of Trump's plans, but now even the Democrats have adopted this idea. The strong-dollar policy is once again becoming the official policy of the United States.
We wouldn't be surprised if the ECB lowered the rate by 0.50% at its October meeting.

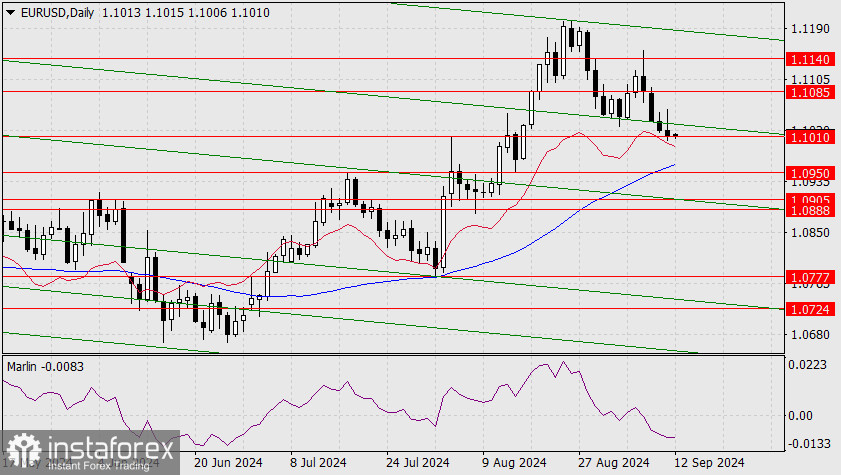
In the daily chart, the euro rests on the support level of 1.1010. Breaking through yesterday's low of 1.1003 will be the primary signal for movement toward the first target of 1.0950. We expect a correction from the target range of 1.0888-1.0905. The market has reversed in both directions within this range since January, and the embedded line of the descending price channel is located there.

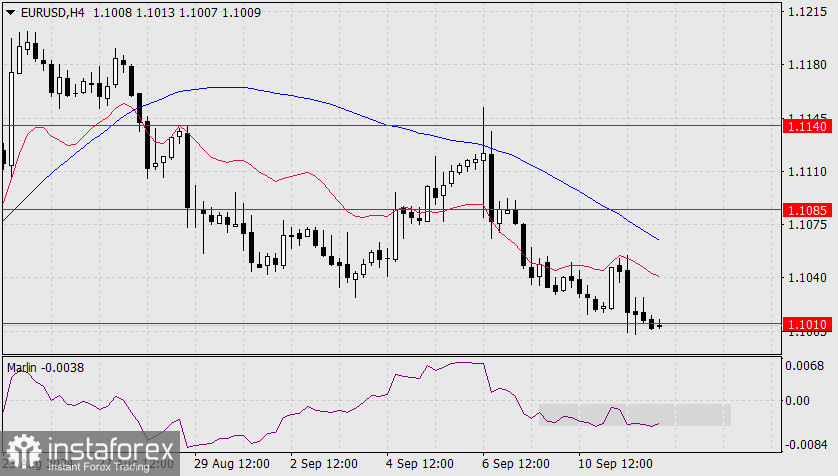
The price is developing below the balance and MACD indicator lines in the four-hour chart, while the Marlin oscillator remains in a sideways trend. Statistically, this pattern suggests subsequent accelerated downward movement.


