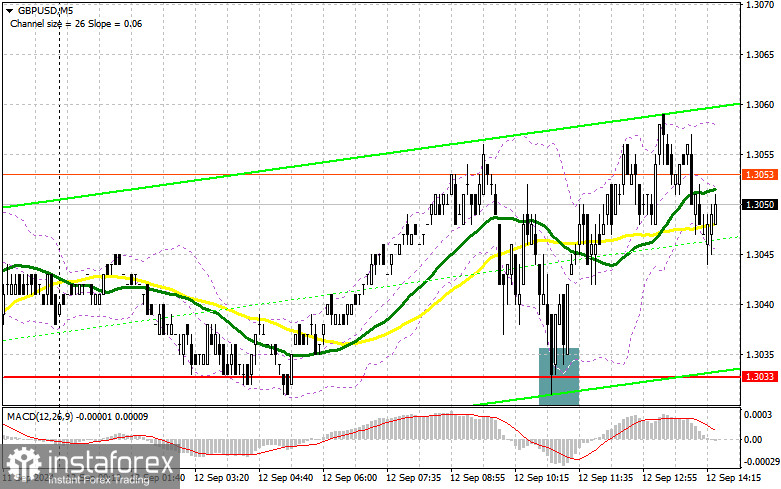
In my morning forecast, I highlighted the 1.3033 level and planned to make trading decisions based on it. Let's review the 5-minute chart to see what happened. A decline followed by a false breakout at this level led to a buying opportunity, resulting in a 30-point rise. The technical outlook for the second half of the day remains unchanged.

To open long positions on GBP/USD:
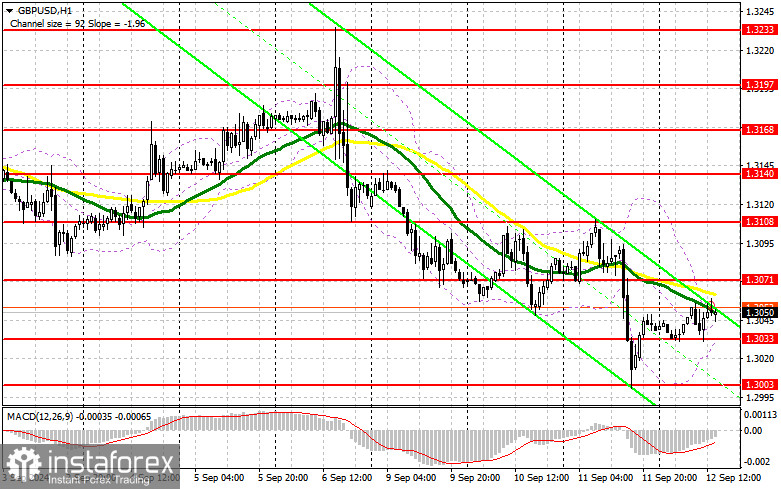
Given the complete absence of UK statistics, it's not surprising that buyers managed to hold their ground around 1.3033. However, it's too early to say that the market has shifted in their favor. What's important is how traders will react to the European Central Bank's decision and the upcoming U.S. data. Expected reports include the number of initial jobless claims, the Producer Price Index, and the core PPI for August. As seen yesterday, if the figures match economists' forecasts, the dollar could rise, causing the pound to fall again, presenting a trading opportunity. In case of a negative reaction to the data, I will return to long positions only after a decline and a false breakout near the 1.3033 support, which has already been tested once today. This will provide an opportunity for a correction and a possible recovery of the pair towards 1.3071. A breakout followed by an upward retest of this range amid lower U.S. inflation will strengthen the chances of an intraday uptrend, triggering stop-losses for sellers and offering a good entry point for long positions, with a target of 1.3108. The final target will be the 1.3140 level, where I plan to close positions. If GBP/USD declines and buyers show no activity around 1.3033 in the second half of the day, pressure on the pair will increase. This will lead to a decline and testing of the 1.3003 support, potentially invalidating buyers' plans. Only a false breakout there will provide a suitable condition for opening long positions. I plan to buy on a rebound from 1.2974, targeting a 30-35 point correction within the day.
To open short positions on GBP/USD:
Sellers have attempted but failed to take full control of the market. U.S. statistics and resistance at 1.3071 could help them. A false breakout there will signal an opportunity to open new short positions to continue the trend and test the 1.3033 support. A breakout and retest from below of this range will hit buyers' positions, triggering stop-losses and paving the way to 1.3003, where I expect more activity from institutional traders. The final target will be the 1.2974 level, where I will close positions. If GBP/USD rises and bears fail to appear at 1.3071 in the second half of the day (with moving averages favoring the bears), buyers may have a chance to stop the downtrend. Bears will then have to retreat to the 1.3108 resistance area. I will sell there only after a false breakout. If there's no downward movement, I will look for short positions on a rebound from 1.3140, targeting a 30-35 point correction within the day.

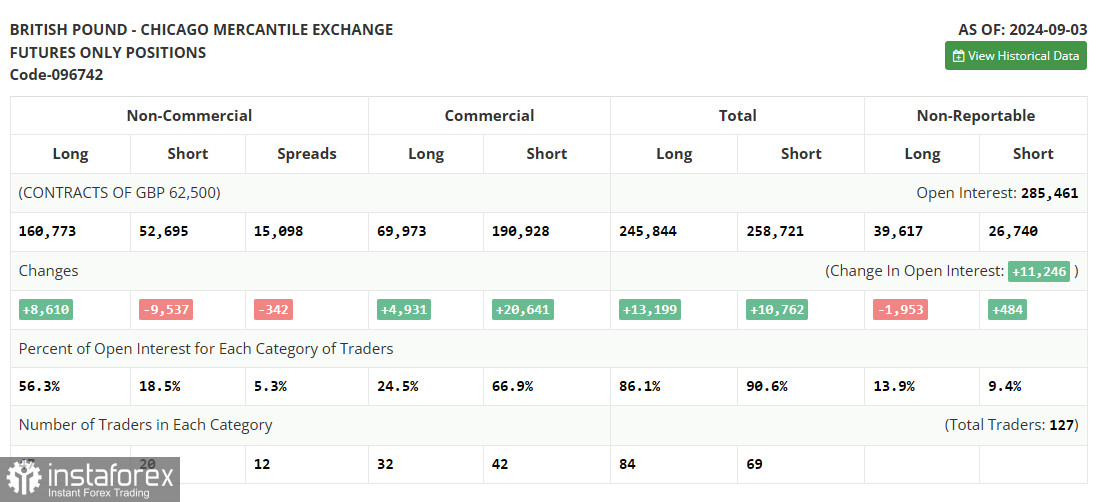
The COT report (Commitment of Traders) for September 3 showed an increase in long positions and a decrease in short ones. It's clear that despite the pair's correction, traders remain confident that U.S. interest rate cuts are more significant than similar actions by the Bank of England. Most likely, the market is currently factoring in future interest rate reductions in the UK, and demand for the pound will return soon, as the medium-term uptrend is still intact. The lower the pair goes, the more attractive it becomes for new purchases. The ratio of long to short positions (three times as many longs) speaks for itself. The latest COT report indicated that long non-commercial positions rose by 8,610 to 160,773, while short non-commercial positions dropped by 9,537 to 52,695. As a result, the gap between long and short positions fell by 342.
Indicator Signals:
Moving Averages
Trading is happening around the 30- and 50-day moving averages, indicating a sideways market.
Note: The period and prices of the moving averages are considered by the author on the H1 chart and may differ from the definition of classic daily moving averages on the D1 chart.
Bollinger BandsIf the pair declines, the lower boundary of the indicator near 1.3033 will provide support.
Indicator Descriptions:• Moving average: Determines the current trend by smoothing volatility and noise. Period – 50. Marked in yellow on the chart.• Moving average: Determines the current trend by smoothing volatility and noise. Period – 30. Marked in green on the chart.• MACD indicator (Moving Average Convergence/Divergence): Fast EMA – period 12, Slow EMA – period 26, SMA – period 9.• Bollinger Bands: Period – 20.• Non-commercial traders: Speculators, such as individual traders, hedge funds, and large institutions using the futures market for speculative purposes.• Long non-commercial positions: Total long open positions of non-commercial traders.• Short non-commercial positions: Total short open positions of non-commercial traders.• Total non-commercial net position: The difference between short and long positions of non-commercial traders.


