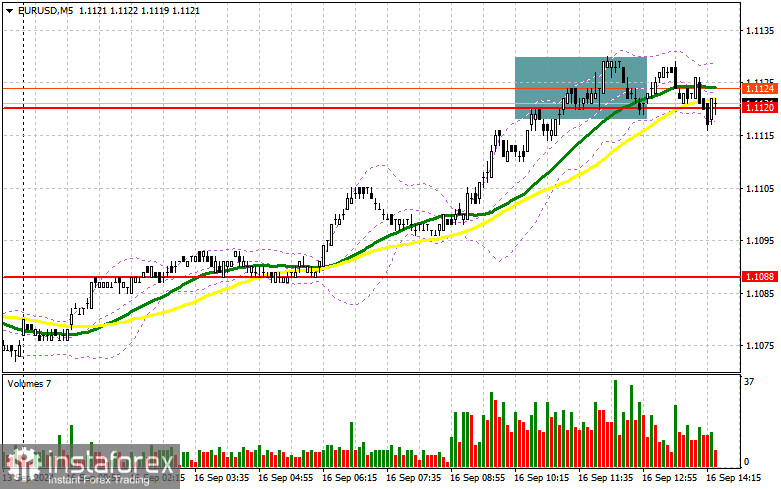
In my morning forecast, I focused on the 1.1120 level and planned to use it as a basis for market entry decisions. Let's take a look at the 5-minute chart and break down what happened. The rise and formation of a false breakout around 1.1120 provided a selling opportunity for the euro. However, no major decline occurred, and the pair stalled around this level. The technical picture has been revised for the second half of the day.

To open long positions on EUR/USD:
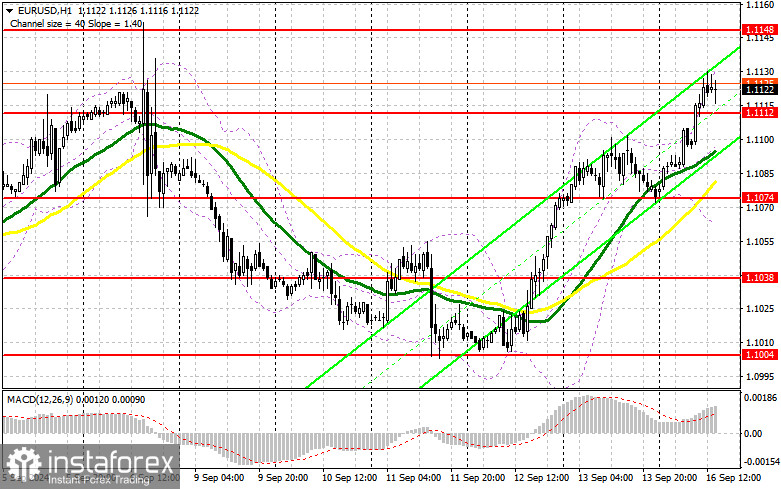
Given the absence of U.S. statistics, the market will likely stay favorable to buyers, benefiting from the upcoming Federal Reserve meeting. The Empire Manufacturing Index numbers are unlikely to have much significance, so it's better to look for buying opportunities on corrections. In my opinion, the new support at 1.1112, formed during the first half of the day, is an ideal entry point. A false breakout at this level will create all the necessary conditions for long positions to continue the bullish trend, aiming for a recovery toward 1.1148, a resistance level that almost matches last week's high. A breakout above this range could lead to further growth, with a chance to test 1.1171. The ultimate target will be the 1.1199 high, where I plan to take profits.
If EUR/USD declines and does not show a rebound around 1.1112 in the second half of the day, selling pressure will increase, leading to a larger sell-off. In that case, I will only enter after a false breakout near the next support at 1.1074, just above the moving averages. I plan to open long positions on a rebound from 1.1038, targeting an upward correction of 30-35 points within the day.
To open short positions on EUR/USD:
Sellers have limited chances, so I will only act after the pair rises and reaches another weekly high. The 1.1148 level will be an appropriate entry point, where a false breakout will signal opening short positions, aiming to test the support at 1.1112, which was formed earlier in the day. A breakout and consolidation below this range, triggered by strong U.S. statistics, along with a retest from below, will provide another selling point with a move toward 1.1074, where today's movement began. The moving averages are also located there, supporting buyers. The ultimate target will be the 1.1038 level, which will nullify all the bulls' plans for further euro growth. I will be taking profits there.
If EUR/USD moves upward and sellers are absent at 1.1148, buyers will have a chance for further growth, updating the resistance at 1.1171. I will also consider selling there, but only after a failed consolidation. I plan to open short positions on a rebound from 1.1199, targeting a downward correction of 30-35 points.

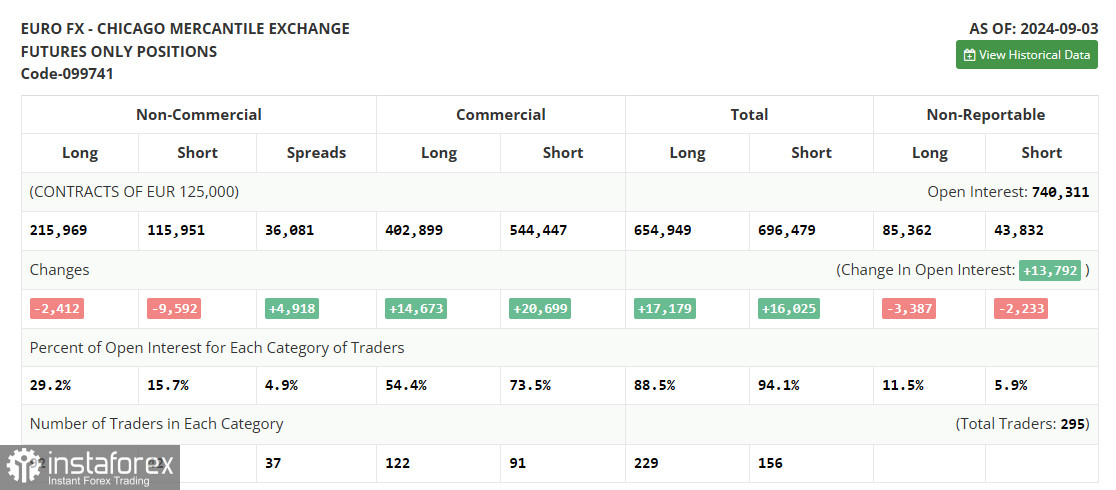
In the Commitment of Traders (COT) report for September 3, there was a reduction in both long and short positions. Despite the decrease in euro sellers, it had no impact on the pair's technical downward picture. Most likely, the euro will continue to lose ground against the dollar this week, as we are expecting the European Central Bank meeting, where we will learn about another rate cut in the Eurozone and future monetary policy. However, this does not cancel the medium-term upward trend in the euro, and the lower the pair goes, the more attractive it becomes for buying. The COT report indicated that long non-commercial positions decreased by 2,412 to 215,969, while short non-commercial positions fell by 9,592 to 115,951. As a result, the gap between long and short positions increased by 4,918.

Indicator Signals:
Moving Averages:
Trading is above the 30- and 50-day moving averages, indicating further growth for the pair.
Note: The periods and prices of the moving averages are considered by the author on the H1 hourly chart and differ from the classical daily moving averages on the D1 daily chart.
Bollinger Bands:
In case of a decline, the lower boundary of the indicator around 1.1070 will act as support.
Indicator Description:
- Moving Average (determines the current trend by smoothing out volatility and noise): Period 50, marked in yellow on the chart.
- Moving Average (determines the current trend by smoothing out volatility and noise): Period 30, marked in green on the chart.
- MACD Indicator (Moving Average Convergence/Divergence): Fast EMA period 12, Slow EMA period 26, SMA period 9.
- Bollinger Bands: Period 20.
- Non-commercial traders are speculators such as individual traders, hedge funds, and large institutions that use the futures market for speculative purposes and meet specific criteria.
- Long non-commercial positions represent the total long open position of non-commercial traders.
- Short non-commercial positions represent the total short open position of non-commercial traders.
- Total non-commercial net position is the difference between short and long positions of non-commercial traders.


