


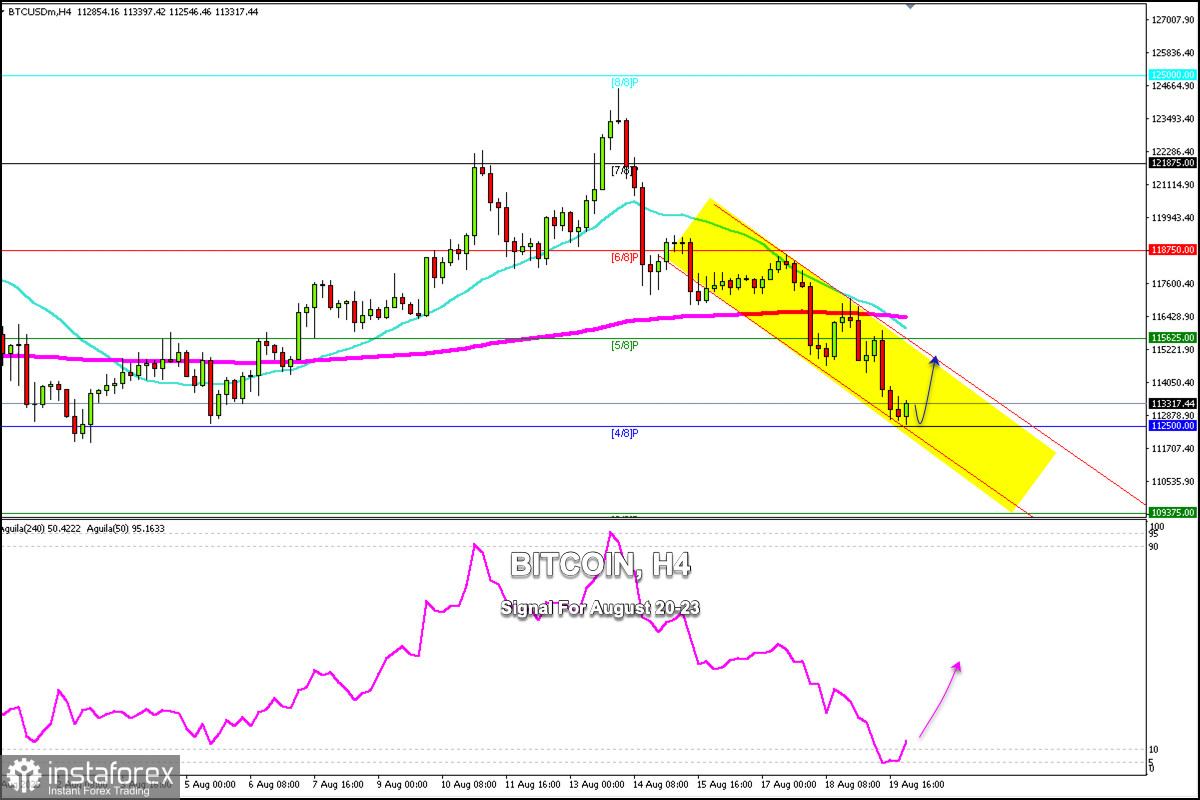
Bitcoin is trading around 113,317, bouncing off the 4/8 Murray level around 112,500.
The 4/8 Murray level seen on the H4 chart represents strong support for Bitcoin. In early August, this support gave BTC a strong bullish push, so we believe that as long as the price trades above this area, any pullback will be seen as a buying opportunity.
A few days ago, Bitcoin reached its all-time high near $125,000. This rapid technical correction to approximately 112,500 means that buyers may be viewing this support level as an opportunity to resume buying.
Market fears driven by profit-taking and uncertainty over Federal Reserve policy are putting pressure on the Bitcoin price. A break below 112,500 could resume the bearish cycle, and we could expect BTC to reach the psychological level of $110,000 around 3/8 of the Murray level.
Immediate support for Bitcoin is located at 112,500, 111,750 (weekly support), and finally at 109,375.
Resistance is located at 114,050, 114,855, 115,625, and finally at the 200 EMA around 116,428.


