Analysis of Trades and Tips for Trading the Euro
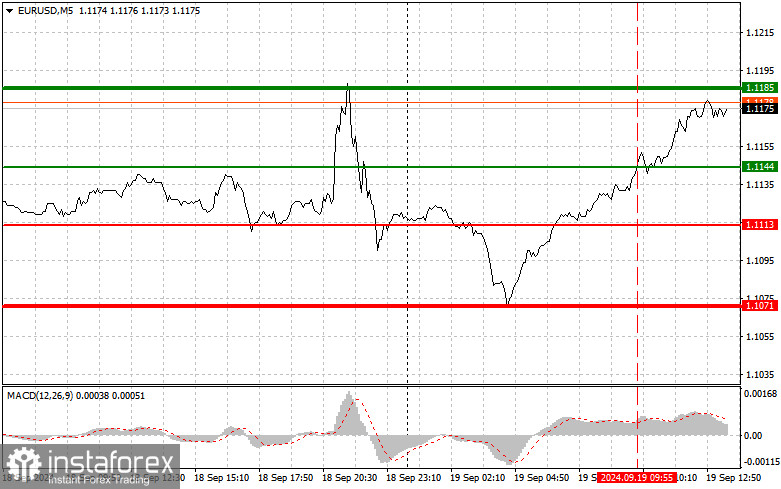
The 1.1144 level was tested when the MACD indicator had already moved significantly above the zero line, limiting the pair's further upward potential. For this reason, I didn't buy the euro, as the risks of a sharp reversal were too high. However, as you can see on the chart, the buyer remained active, and the pair continued to rise. Only strong data related to the U.S. labor and housing markets could hinder the euro's upward potential. We expect figures on initial jobless claims and existing home sales. If the data meets economists' forecasts, the euro will likely continue to rise. Regarding intraday strategy, I plan to follow scenarios #1 and #2 to continue the upward movement.

Buy Signal
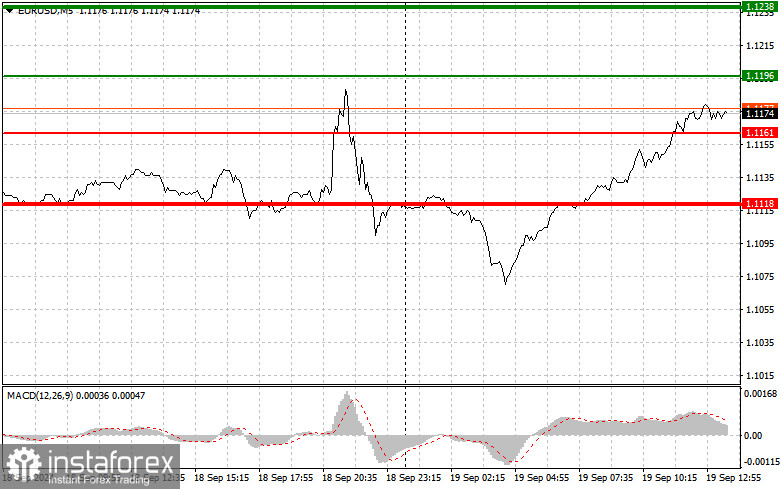
Scenario #1: Today, I plan to buy the euro when the price reaches around 1.1196 (green line on the chart) with a target of 1.1238. I will exit the market at 1.1238 and sell the euro, aiming for a 30-35 point movement in the opposite direction from the entry point. A strong upward movement in the euro today can be expected as part of the ongoing uptrend.Important: Before buying, make sure the MACD indicator is above the zero line and just starting to rise.
Scenario #2: I also plan to buy the euro today if there are two consecutive tests of the 1.1161 price level while the MACD indicator is in the oversold zone. This will limit the pair's downward potential and trigger an upside reversal. Growth towards the resistance levels of 1.1196 and 1.1238 can be expected.
Sell Signal
Scenario #1: I will sell the euro after reaching the 1.1161 level (red line on the chart). The target will be 1.1118, where I plan to exit the market and buy the euro in the opposite direction (aiming for a 20-25 point movement from that level). Pressure on the pair will return if it fails to hold above the daily high.Important: Before selling, ensure that the MACD indicator is below the zero line and has just begun its downward move.
Scenario #2: I also plan to sell the euro today if there are two consecutive tests of the 1.1196 price level when the MACD indicator is in the overbought zone. This will limit the pair's upward potential and trigger a downward reversal. A decline towards the 1.1161 and 1.1118 levels can be expected.

Chart Key:
- Thin green line – entry price for buying the trading instrument.
- Thick green line – assumed price where you can place a Take Profit or manually secure profits, as further growth above this level is unlikely.
- Thin red line – entry price for selling the trading instrument.
- Thick red line – assumed price where you can place a Take Profit or manually secure profits, as further decline below this level is unlikely.
- MACD Indicator – When entering the market, it's essential to consider overbought and oversold zones.
Important: Beginner forex traders should be cautious when making entry decisions. It's best to stay out of the market before major fundamental reports are released to avoid sharp price fluctuations. If you decide to trade during news releases, always place stop orders to minimize losses. Without stop orders, you can quickly lose your entire deposit, especially if you're trading large volumes without proper money management.
Remember, successful trading requires a clear trading plan, such as the one presented above. Spontaneous trading decisions based on current market conditions are typically unprofitable for intraday traders.


