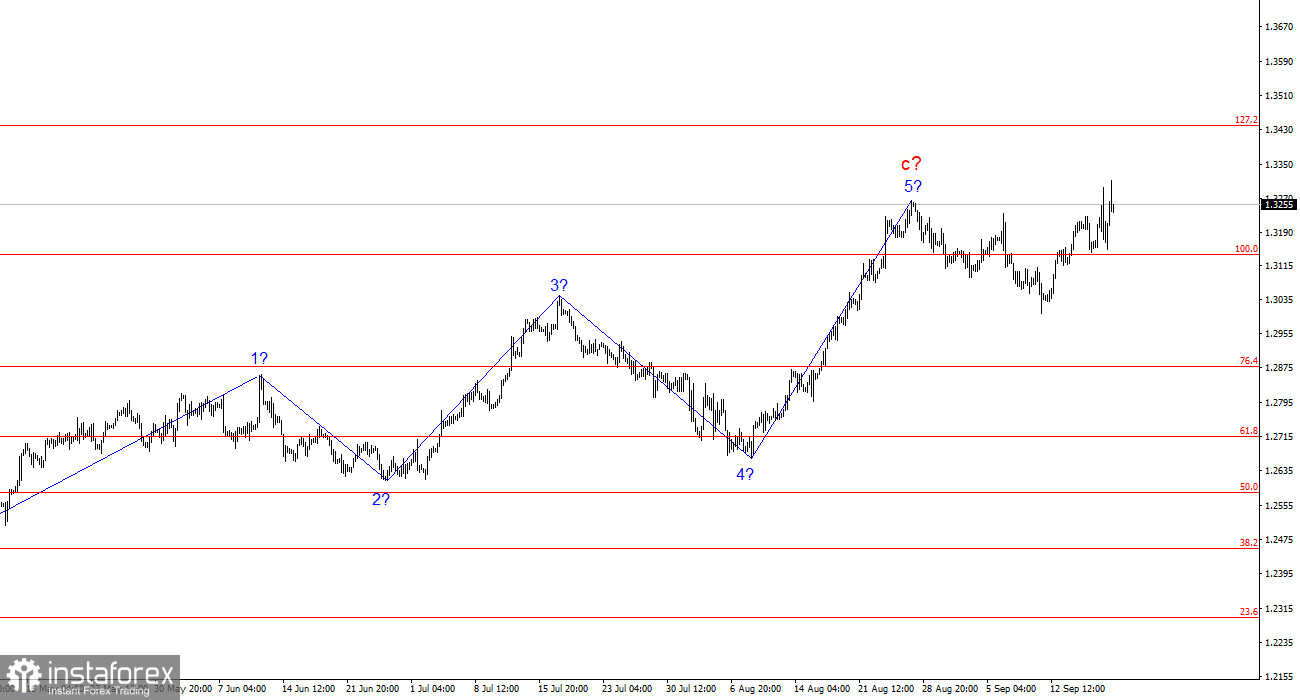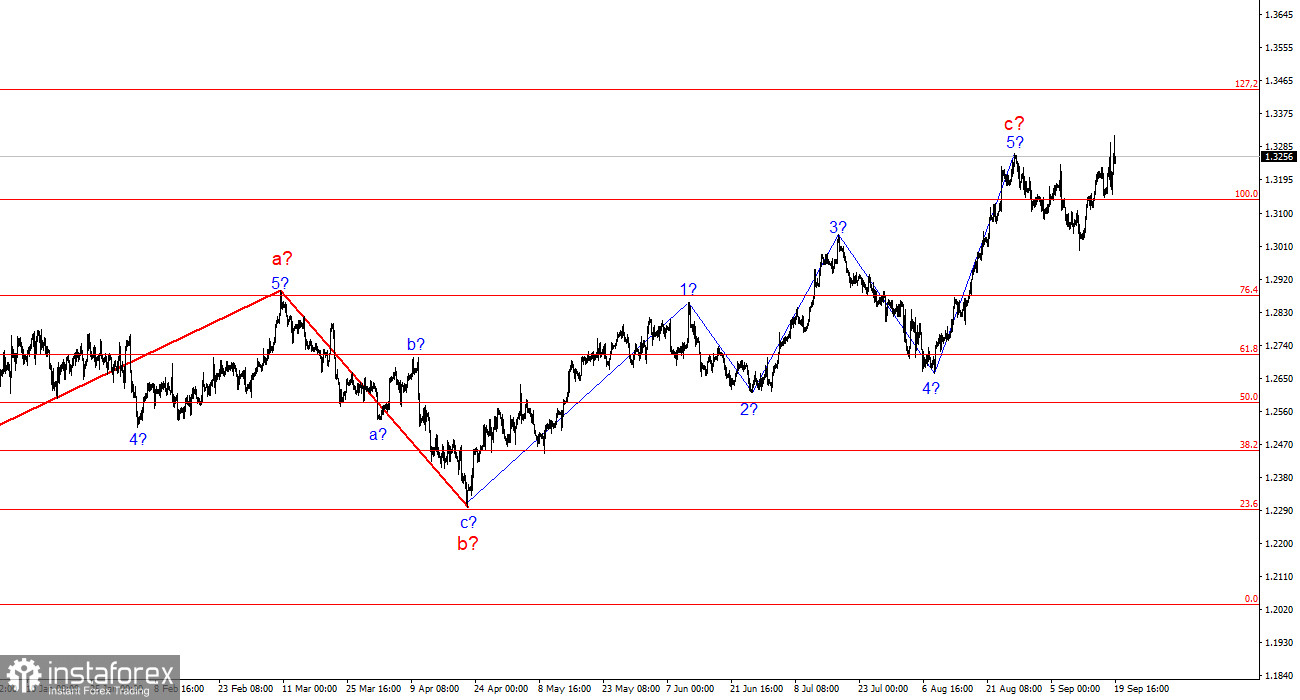
The wave structure for GBP/USD remains quite complex and ambiguous. For a while, the wave pattern seemed convincing, suggesting a downward wave sequence with targets below the 23rd figure. However, in practice, the demand for the British pound rose too sharply for this scenario to play out, and it continues to rise.
At the moment, the wave structure has taken on a very complicated form. I prefer to use simple structures in my analysis, as complex ones often carry too many nuances and potential ambiguities. Currently, we are seeing another upward wave that has taken the instrument beyond the triangle. The ongoing upward wave sequence, which presumably began on April 22, could become even more extended, as the market seems unsettled until it fully processes the Federal Reserve's rate cut stages. In recent weeks, we have seen the formation of a three-wave corrective structure, which may be a corrective wave within the overall upward trend. If this is the case, the rise in quotes could continue for several more months.
The GBP/USD exchange rate over Wednesday and Thursday was primarily characterized by volatility, with constant shifts in direction. On Wednesday, the market traded on emotions related to the Federal Reserve, while Thursday saw reactions tied to both the Fed and the Bank of England. However, I avoid factoring such emotional movements into my wave analysis. The Bank of England did not indicate in its statement that the pause in rate cuts would be long. It acknowledged the problem of high inflation and the risks of its acceleration, but it also mentioned that rate decisions would be made on a meeting-by-meeting basis, depending on incoming data. In my view, the BoE did not adopt a clear dovish or hawkish stance. In other words, it has initiated policy easing and will continue it, just not at the same pace as the Fed. It's also worth noting that the ECB is not planning to cut rates at every meeting, so intermittent pauses are to be expected.
The market reacted twice with increased demand for the pound, and both times it retraced. Despite some favorable aspects for the pound, such as only one MPC member voting for a rate cut, there are still factors suggesting that the market is treating the U.S. dollar too harshly. A successful attempt to break through the peak of wave 5 cannot be considered definitive proof of a continued upward trend. If that happens, the internal wave structure will become even more complicated.
General Conclusions.
The wave structure for GBP/USD still suggests a decline. If the upward section of the trend began on April 22, it has already developed into a five-wave pattern. The corrective wave has formed a three-wave structure, but in my opinion, it is too small to expect a new upward trend to form at this stage. I still find selling this instrument more attractive, but now we need signals. We can focus on the 1.3264 mark, and the MACD divergence warns of a potential decline.
On the larger wave scale, the wave structure has evolved. We can now assume the formation of a complex and extended upward corrective pattern. At present, it is a three-wave structure, but it could evolve into a five-wave structure, which may take several more months or even longer to form.
Key Principles of My Analysis:
- Wave structures should be simple and clear. Complex structures are difficult to trade and often lead to changes.
- If there is uncertainty about the market, it's better not to enter it.
- There is never 100% certainty in the direction of movement. Don't forget to use protective Stop Loss orders.
- Wave analysis can be combined with other forms of analysis and trading strategies.


