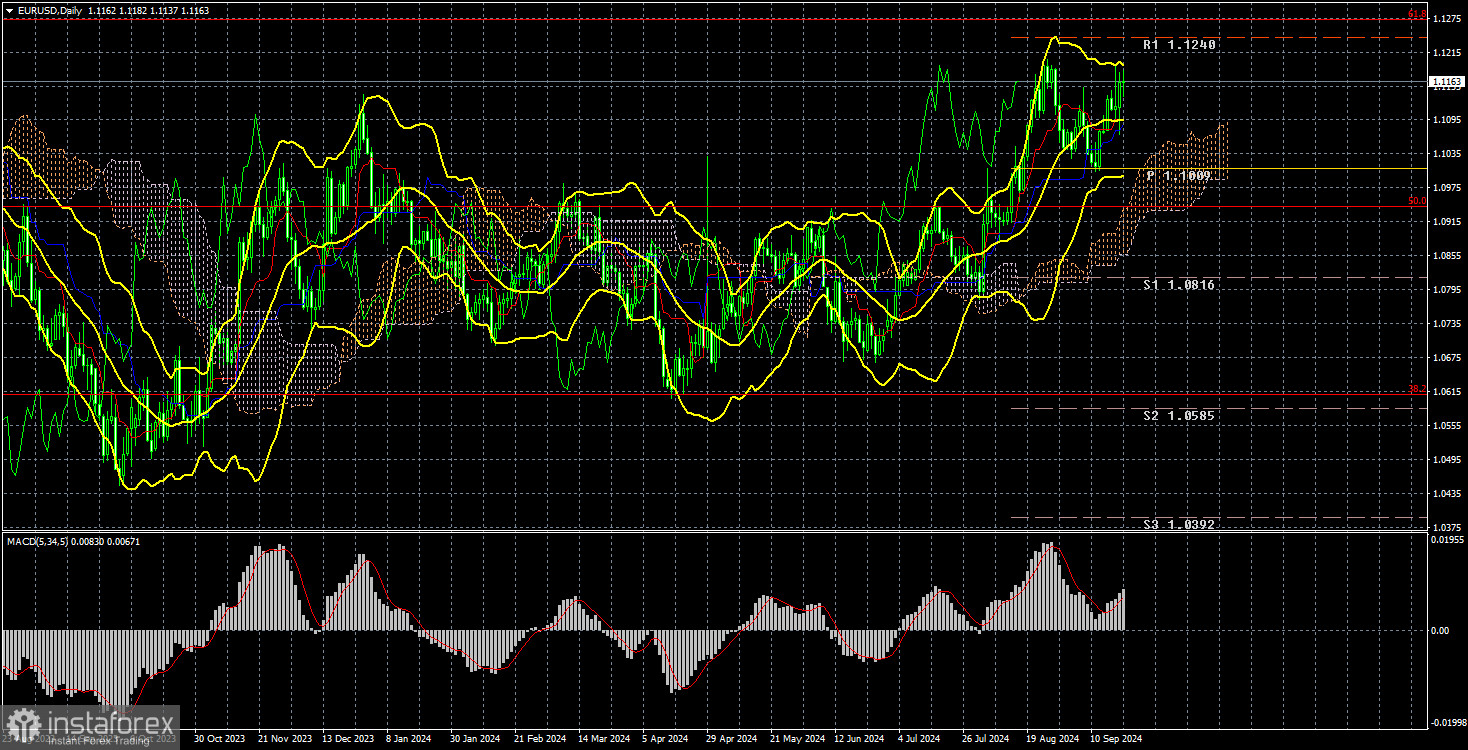
Long-term Perspective

The EUR/USD currency pair showed a confident rise during this week. It should be noted that the European currency has been in an upward trend for two years. Initially, this movement could be seen as a correction against the previous decline, and later as the market anticipating the Federal Reserve's easing of monetary policy (due to the drop in inflation in the U.S.). However, as time passes and the dollar weakens further, one might question how much longer these factors will continue to affect the dollar.
Let's consider this: while a correction is normal, it coincides with the start of the inflation decline in the U.S. Therefore, the pair has already sufficiently corrected based on this single factor—it has, after all, been two years. This week, the Fed officially began easing its monetary policy, yet the dollar continues to fall. If the market had not been anticipating rate cuts in the U.S. beforehand, then why has the dollar been falling for two years?
Of course, everything in the forex market (and any other market) depends on supply and demand. Large players (market makers) can trade regardless of macroeconomic statistics or fundamental background. Simply put, they possess the capital needed to move the price up or down, unlike private traders. Usually, the fundamental background—which reflects financial conditions, economic prospects, central bank actions, and the broader economic outlook—aligns with the actions taken by major players. However, that's not the case at the moment.
The European currency remains unaffected by the ECB's easing policy. The state of the European economy remains weak, close to stagnation, with unemployment higher than in the U.S. and inflation hovering around the target level. However, none of these factors seem to be affecting the market, so we must focus on technical analysis.
After a brief downward correction, the price resumed its rise. It failed to consolidate below the critical line, meaning there's no sign of the medium-term upward trend ending, which still appears to be a correction against the earlier, stronger decline.
COT Analysis
The latest COT report, dated September 17, clearly shows that the net position of non-commercial traders has remained "bullish" for a long time. An attempt by bears to gain dominance failed miserably. The net position of non-commercial traders (red line) decreased in the latter half of 2023 and into the beginning of 2024, whereas the net position of commercial traders (blue line) increased. Currently, professional players are once again increasing their long positions.
We still don't see any fundamental factors supporting the euro, while technical analysis indicates that the price is in a consolidation zone—or, simply put, in a sideways movement. The weekly timeframe clearly shows that since December 2022, the pair has been trading between 1.0448 and 1.1274, moving from a seven-month sideways trend to an 18-month one.
Currently, the red (non-commercial traders) and blue (commercial traders) lines are diverging, indicating an increase in long positions on the euro. However, within a sideways trend, such changes do not form the basis for long-term conclusions. In the last reporting week, the number of long positions in the "Non-commercial" group decreased by 10,500, while short positions increased by 1,200. Consequently, the net position fell by 11,700. The euro still has potential for a decline.
Macroeconomic Events Overview
There weren't any significant events in the Eurozone this week. The only somewhat important report was on inflation, but it was published in the second estimate, which didn't differ from the first. On Friday, Christine Lagarde spoke but didn't provide any new information. Meanwhile, the market remained focused on the Fed's meeting throughout the week. Starting on Monday, the dollar began to fall on expectations of a "dovish" Fed decision. It continued to fall on Wednesday following the decision and remained weak on Thursday and Friday. In other words, the market reacted to the same event for five consecutive days. As a result, the dollar could continue to fall for quite some time. The market could already start factoring in upcoming disappointing Non-Farm Payrolls and unemployment figures, and then respond to them once they are released in early October. After that, the market might anticipate another "dovish" Fed decision, even though it's already known that the rate will be cut by another 0.25% at the next meeting.
Trading Plan for the Week of September 23–27:
Long Positions: On the 24-hour timeframe, the pair is trading above all the Ichimoku indicator lines, but from a fundamental and macroeconomic standpoint, the continued growth of the euro still appears highly questionable. Therefore, we have always been skeptical about such a scenario. Moreover, the weekly timeframe is dominated by a sideways movement. Thus, long positions were already risky and are now irrelevant, as the price is in the upper region of the sideways channel.
Short Positions: As for selling the EUR/USD pair, it remains the more promising option. First, the price is near the upper boundary of the new sideways trend—at level 1.1274. Second, there have been no fundamental reasons for a long-term rise in the euro. Third, the market has already more than factored in the easing of the Fed's monetary policy. Fourth, the RSI indicator on the weekly timeframe entered the overbought zone. If this situation doesn't persist for a couple more years, the dollar will start to recover its lost ground.
Explanations for Illustrations:
- Support and resistance levels (resistance/support), Fibonacci levels – targets for opening buy or sell orders. Take Profit levels can be placed around these points.
- Ichimoku indicators (standard settings), Bollinger Bands (standard settings), MACD (5, 34, 5).
- Indicator 1 on COT charts represents the net position size of each trader category.


