EUR/USD

Higher time frames
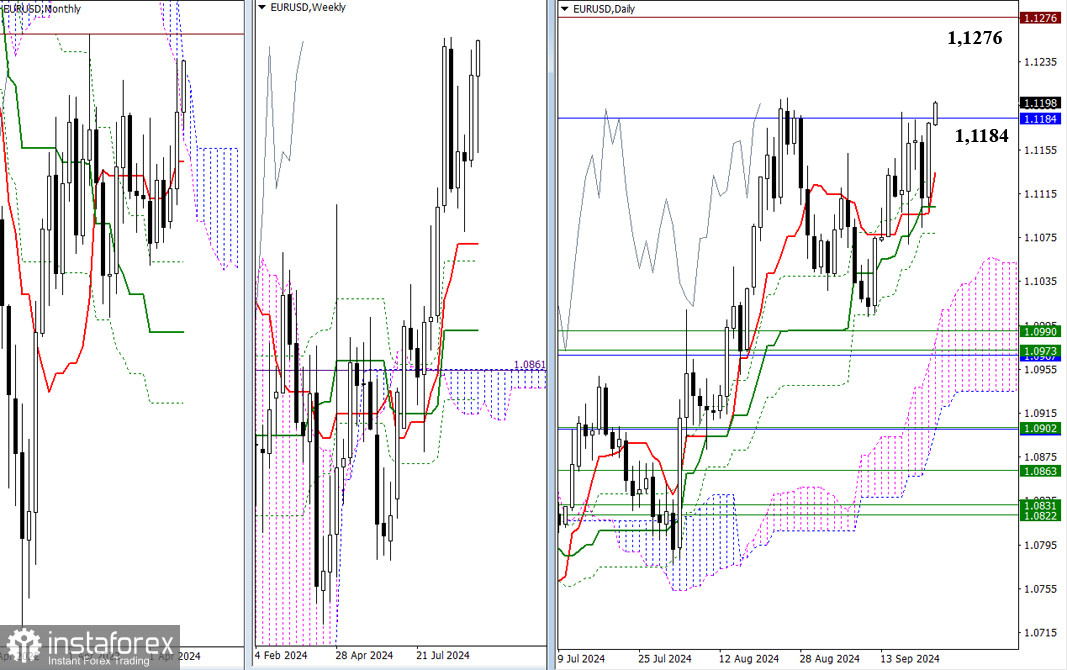
The bulls are not ready to abandon their plans to break into the bullish zone relative to the bearish cloud. Yesterday, they returned to the upper boundary of the cloud (1.1184), and today, they are already close to surpassing the August high (1.1202). If they achieve their goals, the bulls will aim even higher, with the next target being the 2023 high (1.1276). However, if they once again yield the initiative to their opponents, the market will first head back towards the support of the daily Ichimoku cross. Today's cross levels are 1.1134, 1.1126, 1.1103, and 1.1079.

H4 – H1
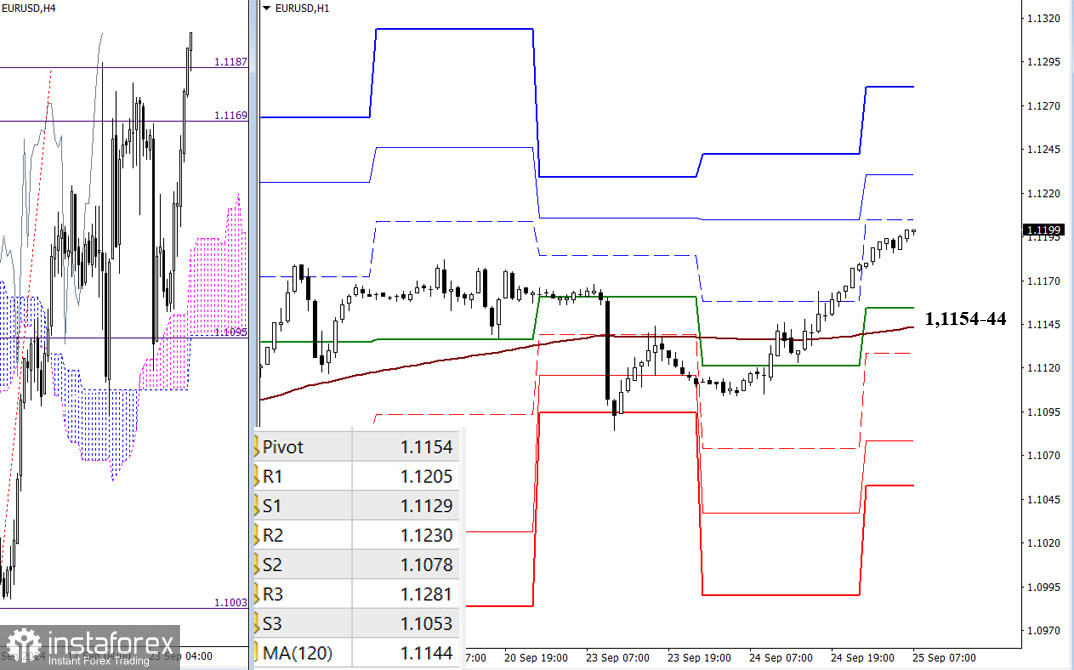
The bulls have the main advantage again in the lower time frames. The H4 target has been breached, and the upward trend is developing. The reference points for the bulls within the day are the resistance levels of the classic pivot points (1.1205 – 1.1230 – 1.1281). The key levels today act as support, located around 1.1154 – 1.1144 (central pivot point of the day + weekly long-term trend). In the event of a breakout and trend reversal, we may witness another shift in priorities. Bearish sentiments within the day could be strengthened if the pair breaches the supports of the classic pivot levels (1.1129 – 1.1078 – 1.1053).
***
GBP/USD

Higher time frames
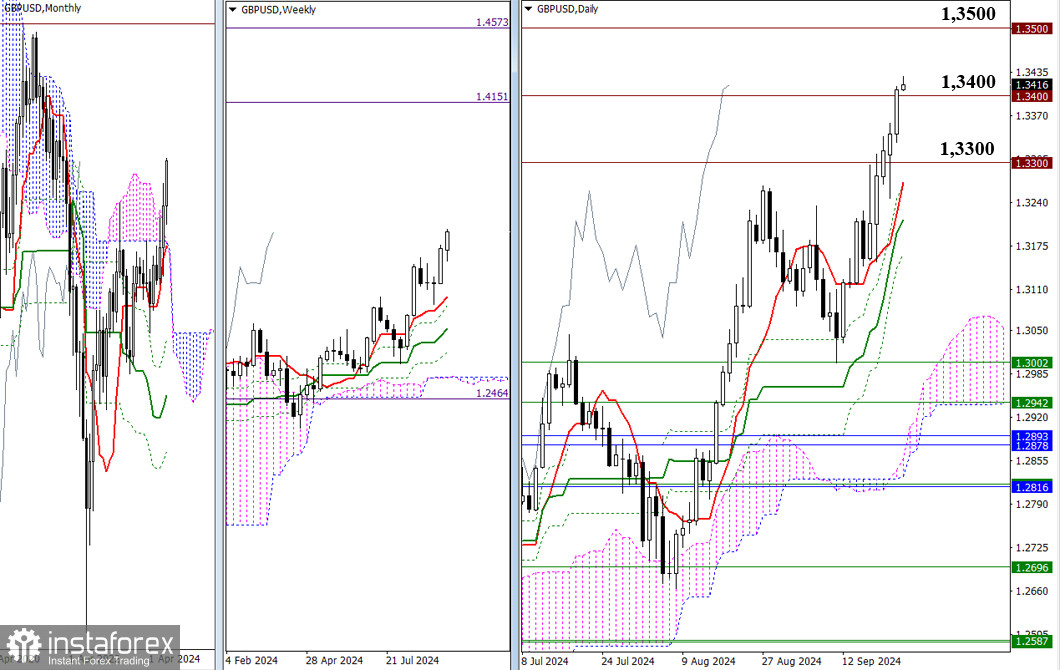
The bulls continue their ascent, during which they tested the psychological level of 1.3400 yesterday, closing the day above it. Today, a slowdown is possible due to the encounter with 1.3400; however, if the bulls continue their rise, the next target could be the 1.3500 mark. Currently, the situation is such that bullish targets, like the weekly goal of breaking through the Ichimoku cloud (1.4151 – 1.4573), are located quite far from the price chart. In case of bearish activity, the previously crossed level of 1.3300 may act as support, and further, the bears will encounter the levels of the daily Ichimoku cross (1.3270 – 1.3215 – 1.3164).

H4 – H1
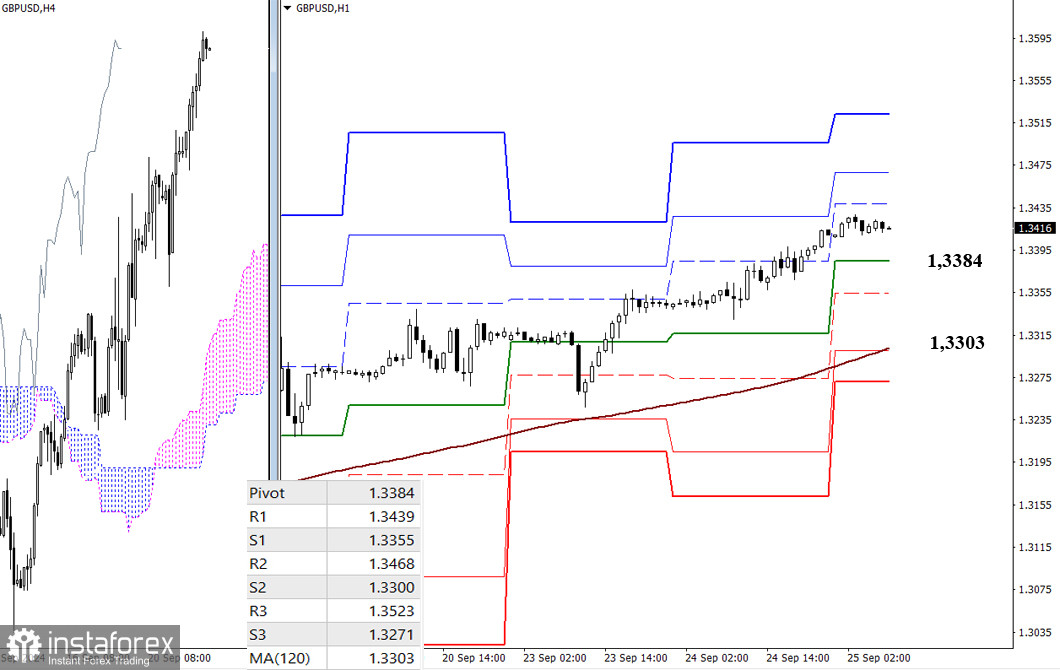
The bulls currently hold the advantage in the lower time frames and are developing an upward trend. The classic pivot levels serve as reference points for them within the day (1.3439 – 1.3468 – 1.3523). If bearish activity manifests in the market, breaking through crucial levels such as the central pivot point of the day (1.3384) and the weekly long-term trend (1.3303) will be significant. Intermediate support on this path could come from S1 (1.3355). A breakout and reversal of the trend would help to change the current balance of power.
***
This technical analysis is based on the following ideas:
Larger time frames - Ichimoku Kinko Hyo (9.26.52) + Fibo Kijun levels
H1 – classic pivot points + 120-period Moving Average (weekly long-term trend)


