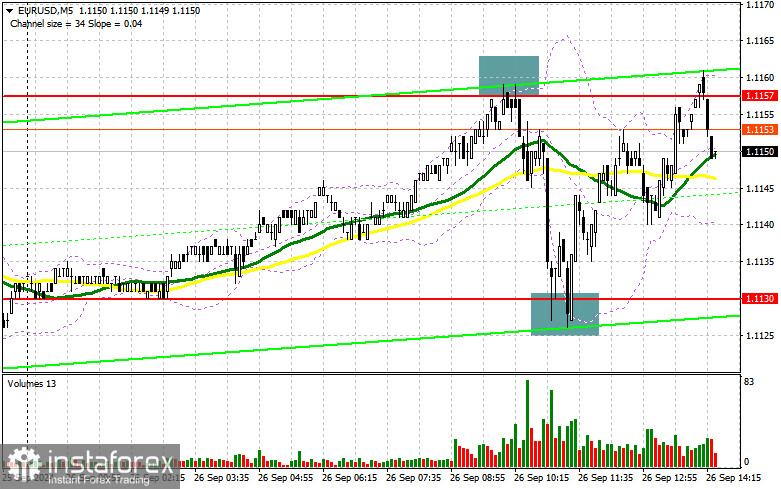
In my morning forecast, I focused on the 1.1130 level and planned to base my market entry decisions on it. Let's examine the 5-minute chart to analyze what occurred. The decline and subsequent formation of a false breakout around 1.1187 created an excellent entry point for buying the euro, resulting in a rise of the pair by more than 30 points. Active selling around the 1.1157 level at the start of the European session also allowed for a profit of about 20 points. The technical picture for the second half of the day remains unchanged.

Requirements for Opening Long Positions on EUR/USD:
There is a significant amount of important data expected in the second half of the day, so let's discuss this first. We anticipate the release of figures on the revised U.S. GDP for the second quarter. If this figure is revised upward, it could help strengthen the U.S. dollar against the euro, along with news about a decrease in initial jobless claims and an increase in durable goods orders. However, the most critical events will be speeches by Federal Reserve Chair Jerome Powell and Treasury Secretary Janet Yellen. Any direct hints at a rate cut in the U.S. in November could weaken the dollar's position.
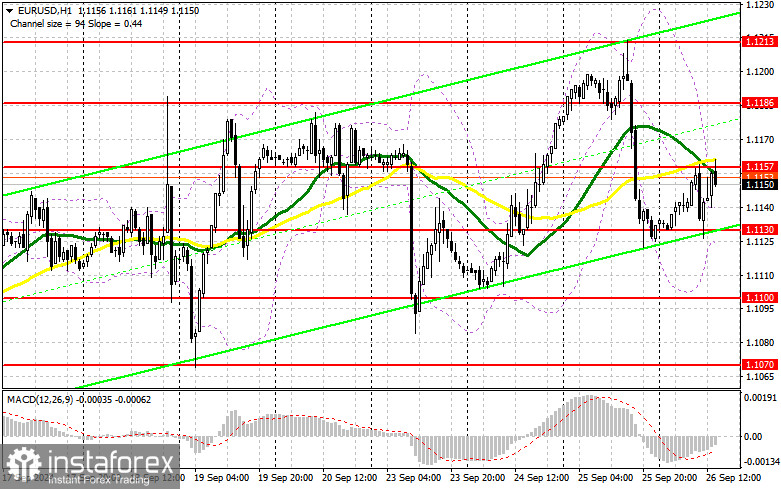
If the pair declines, a false breakout around the 1.1130 level will provide a suitable opportunity to open new long positions, with a target to return to 1.1157. A breakout and a subsequent downward retest of this range could lead to further growth, with a chance to test 1.1186. The highest target will be the 1.1213 level, where I plan to take profits. If EUR/USD declines further and there is no activity around the 1.1130 level in the second half of the day (a level already tested earlier today), pressure on the pair might resume, potentially leading to a larger sell-off. In such a case, I will only consider entering after a false breakout around the next support at 1.1100. I plan to open long positions from the 1.1070 level, aiming for an intraday upward correction of 30-35 points.
Requirements for Opening Short Positions on EUR/USD:
Sellers have a chance to push the euro downward, but this will require strong U.S. data and the defense of the 1.1157 level. Only a false breakout at that level, similar to the situation described earlier, will provide a suitable condition for opening short positions, aiming for a correction toward the 1.1130 support level. At this point, I expect new and fairly active buying, especially if there is weak U.S. labor market data. A breakout and consolidation below this range, followed by an upward retest, will offer another selling opportunity, targeting the 1.1100 level, where I expect to see stronger euro buyers emerging. The ultimate target will be the 1.1070 level, which would completely negate the bulls' plans for further growth. This is where I will be taking profits. If EUR/USD rises and there is no bearish activity around 1.1157, the bulls are likely to push the euro higher. In that case, I will postpone selling until reaching the next resistance level at 1.1186, where I'll consider selling after a failed consolidation. I plan to open short positions from the 1.1213 level, targeting a downward correction of 30-35 points.

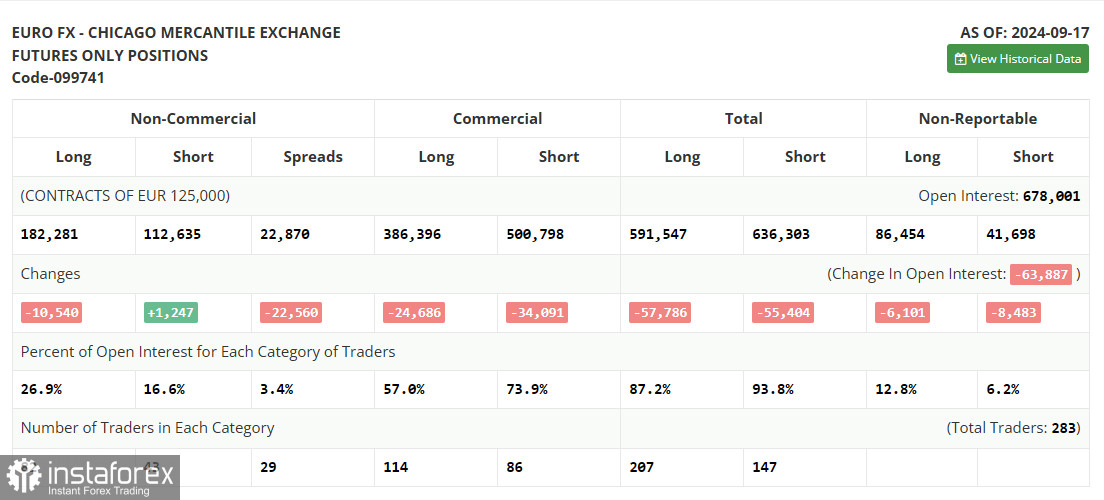
In the Commitment of Traders (COT) report dated September 17, there was a reduction in long positions and a slight increase in short positions. The Federal Reserve's decision to cut rates by 0.5% was quite unexpected, but traders did not significantly adjust their positions, still favoring the euro's strength over the U.S. dollar. In the near future, we will mostly see speeches from representatives of the Fed and the European Central Bank, without any significant fundamental statistics expected. As a result, market volatility may decrease. However, this does not negate the medium-term upward trend for the euro, and the lower the pair goes, the more attractive it becomes for buyers. The COT report showed that long non-commercial positions decreased by 10,540 to 182,281, while short non-commercial positions increased by 1,247 to 112,635. Consequently, the spread between long and short positions narrowed by 20,560.

Indicator Signals:
Moving Averages
Trading is occurring around the 30 and 50-day moving averages, indicating market uncertainty.
Note: The moving averages' periods and prices are considered on the H1 hourly chart by the author and differ from the classical daily moving averages on the D1 daily chart.
Bollinger Bands
In case of a decline, the lower boundary of the indicator around 1.1130 will act as support.
Indicator Descriptions:
- Moving average: Defines the current trend by smoothing volatility and noise. Period 50, marked in yellow on the chart.
- Moving average: Defines the current trend by smoothing volatility and noise. Period 30, marked in green on the chart.
- MACD Indicator (Moving Average Convergence/Divergence): Fast EMA period 12, Slow EMA period 26, SMA period 9.
- Bollinger Bands: Period 20.
- Non-commercial traders: Speculators, including individual traders, hedge funds, and large institutions using the futures market for speculative purposes, meeting certain requirements.
- Long non-commercial positions: Represent the total long open positions held by non-commercial traders.
- Short non-commercial positions: Represent the total short open positions held by non-commercial traders.
- Total non-commercial net position: The difference between short and long positions held by non-commercial traders.


