Analysis of Monday's Trades:
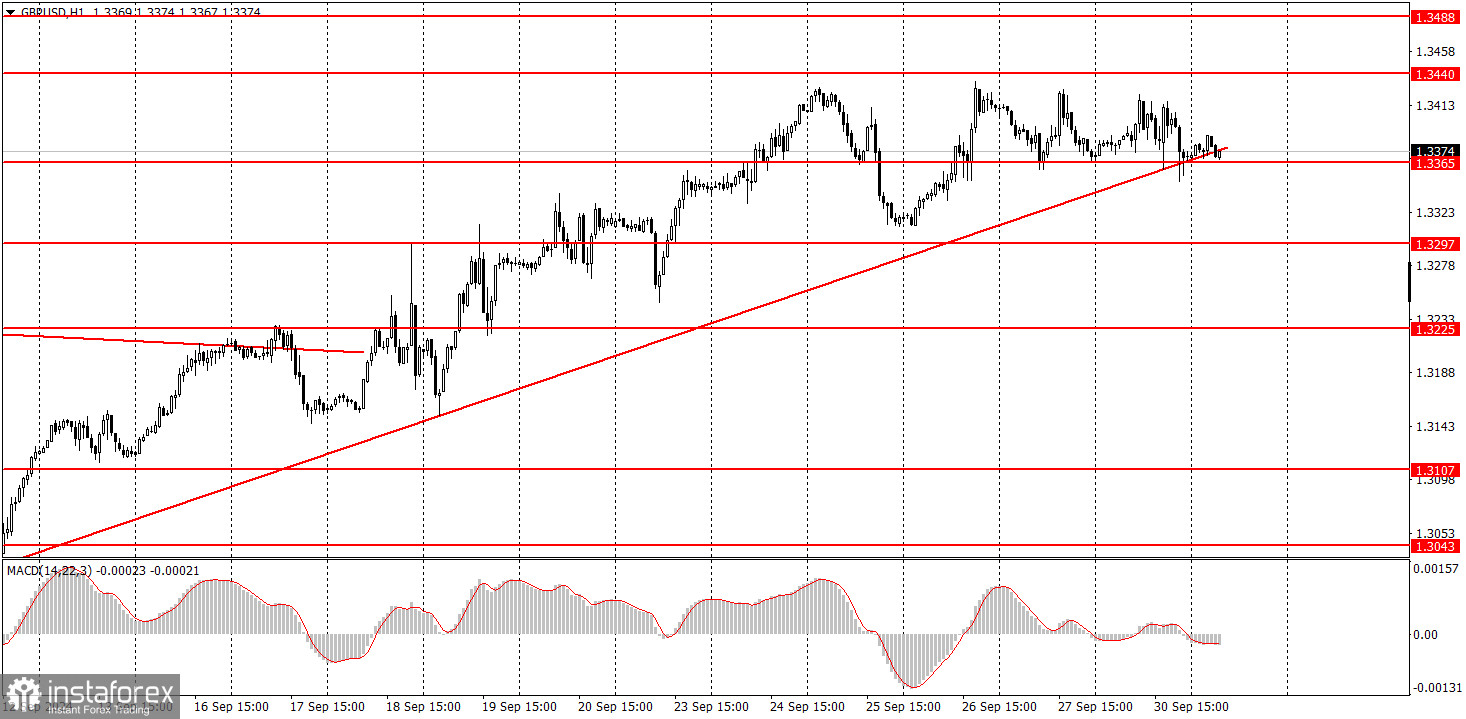
1H Chart of the GBP/USD Pair

The GBP/USD pair also attempted a slight correction on Monday, but it once again went poorly. The pound sterling has been stuck in a narrow flat range for the third consecutive day, happening at the highest levels in the last two years. Yesterday, Federal Reserve Chair Jerome Powell did everything to convince the market that the Fed does not intend to lower the rate by 0.5% at the next meeting. And all that the dollar could manage was a rise of a meager 40 pips. Since the pound sterling was rising for no apparent reason, even before Powell's speech, the dollar did not gain a single point, as per yesterday's results.
Once again, we saw an illustration of how the market reacts to all incoming information. Even if strong or hawkish data comes from the US, it does not help the US currency because market participants refuse to buy it. This week, several more crucial reports will be released in the US, and there's no doubt that the market will look for any excuse to start selling the dollar again. If the flat continues and the price crosses the trend line, this will not be considered a downward trend change.
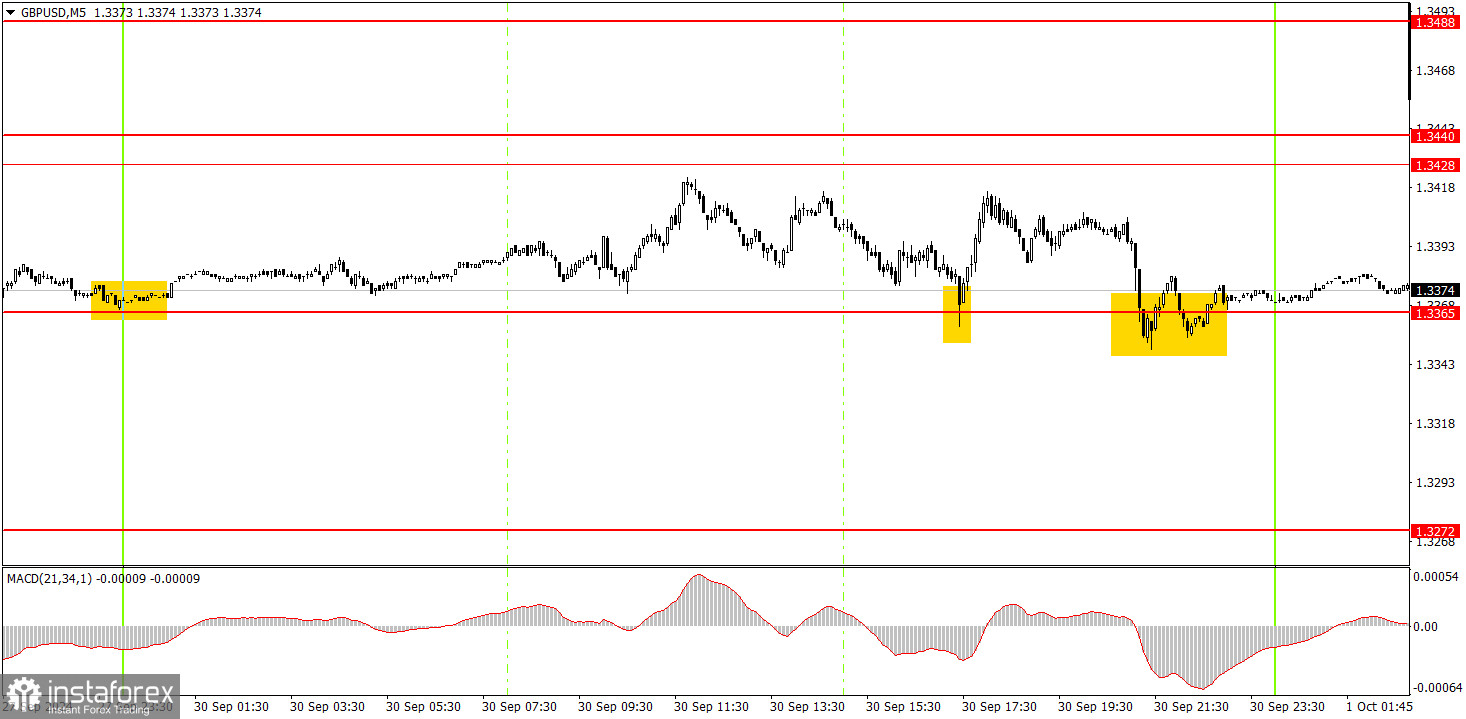
5M Chart of the GBP/USD Pair

In the 5-minute time frame on Monday, the price bounced off the 1.3365 level three times. Not always precisely, but it did bounce off. Thus, novice traders could open two buy positions. In both cases, the price moved in the intended direction by at least 35 pips, so there could not have been any losses on these trades. If the trades were closed manually, a profit of 30-40 pips could have been achieved.
How to Trade on Tuesday:
In the hourly time frame, the GBP/USD pair is again moving upward despite no new reasons. There are no issues with volatility at the moment, so at least within each trading day, traders can open positions rather than just watching the minimal movements that could be called "convulsions." However, there are still significant problems with the logic of these movements. We continue to see the pair rise even when all factors favor the dollar. Corrections are minimal or nonexistent.
On Tuesday, the pound sterling may attempt to resume its upward movement again, as it doesn't require any particular factors. Trading can be done from the 1.3365 level.
In the 5-minute time frame, trading can currently be done using the levels 1.2913, 1.2980–1.2993, 1.3043, 1.3102–1.3107, 1.3145–1.3167, 1.3225, 1.3272, 1.3365, 1.3428–1.3440, 1.3488, 1.3537. On Tuesday, only the Manufacturing PMI for the second estimate of September will be published in the UK, while in the US, there will be much more important reports, such as the ISM Manufacturing Index and JOLTs Job Openings.
Basic Rules of the Trading System:
1) Signal Strength: The strength of a signal is determined by the time it takes to form (bounce or break through a level). The less time it takes, the stronger the signal.
2) False Signals: If two or more trades are opened near a certain level based on false signals, all subsequent signals from that level should be ignored.
3) Flat Market: In a flat market, any pair can generate numerous false signals or none at all. In any case, it's better to stop trading at the first signs of a flat market.
4) Trading Timeframe: Trades should be opened between the start of the European session and the middle of the American session, after which they should be closed manually.
5) MACD Indicator Signals: In the hourly time frame, it is preferable to trade based on MACD signals only when there is good volatility and a trend confirmed by a trendline or trend channel.
6) Close Levels: If two levels are located too close to each other (between 5 and 20 pips), they should be considered as a single support or resistance area.
7) Stop Loss: Once the price moves 20 pips in the intended direction, a Stop Loss should be set at the breakeven point.
What's on the Charts:
Support and Resistance Price Levels: These levels serve as targets when opening buy or sell positions. They can also be used as points to set Take Profit levels.
Red Lines: These represent channels or trend lines that display the current trend and indicate the preferred trading direction.
MACD Indicator (14,22,3): The histogram and signal line serve as an auxiliary indicator that can also be used as a source of trading signals.
Important Speeches and Reports (always found in the news calendar) can significantly impact the movement of a currency pair. Therefore, trading should be done with maximum caution during their release, or you may choose to exit the market to avoid a sharp price reversal against the preceding movement.
For Beginners Trading on the Forex Market: It's essential to remember that not every trade will be profitable. Developing a clear strategy and practicing money management is key to achieving long-term success in trading.


