


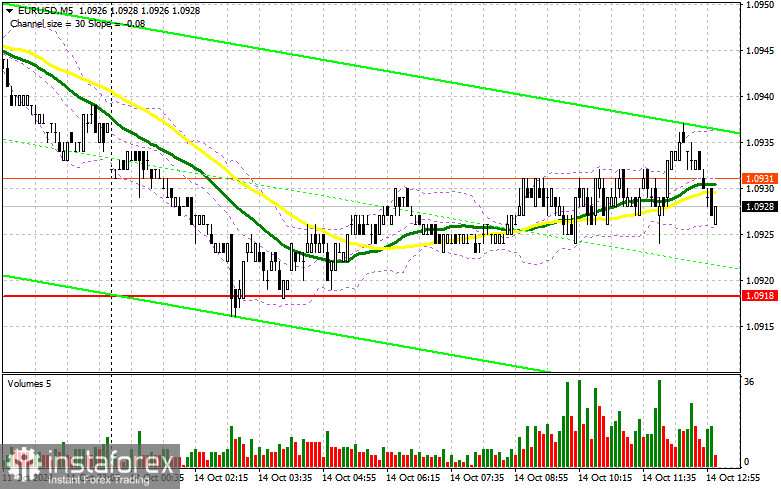
In my morning forecast, I focused on the 1.0918 level and planned to make market entry decisions based on it. Let's look at the 5-minute chart to analyze what happened. The pair's decline occurred, but it didn't reach the 1.0918 level, so I didn't find any suitable entry points in the first half of the day. The technical picture for the second half of the day remains unchanged.
For Opening Long Positions on EUR/USD:
The absence of significant data impacted the euro, as expected. Low volatility may continue into the second half of the day, as the calendar only includes a few FOMC member speeches. It is likely that their statements will not have much impact after last week's series of speeches from Fed officials. I expect trading to remain within the sideways channel. If the pair declines, a false breakout near the 1.0918 support level could provide a good opportunity to increase long positions, opening the way toward 1.0952, a level the pair has struggled to break above. A breakout and retest of this range would confirm a solid entry point for buying, with a target of reaching 1.0979. The final target will be the 1.1011 high, where I will take profit. If EUR/USD continues to decline and shows no activity near 1.0918 in the second half of the day, pressure on the euro will persist. In that case, I'll enter only after a false breakout near the next support level at 1.0884. I plan to open long positions from 1.0855 on a rebound, aiming for an upward correction of 30-35 points within the day.
For Opening Short Positions on EUR/USD:
Sellers haven't disappeared but are in no hurry to act. If FOMC members make very soft statements, the euro may see a temporary rise. In this case, a false breakout near 1.0952 would offer a good entry point for new short positions with a potential decline toward the 1.0918 support. A breakout and consolidation below this range, followed by a retest from the bottom-up, would be another suitable scenario for selling, with a move toward 1.0884, strengthening the bearish market. Only there do I expect to see more active bulls. The final target will be around 1.0855, where I will take profit. If EUR/USD moves upward in the second half of the day and there is no bearish activity near 1.0952, buyers will have a chance for a slight strengthening of the pair at the start of the week. In that case, I will postpone selling until the next resistance test at 1.0979. I will also sell there, but only after an unsuccessful attempt at consolidation. I plan to open short positions on a rebound from 1.1011, aiming for a downward correction of 30-35 points.
The COT report (Commitment of Traders) for October 1 showed a slight increase in short positions and a sharp reduction in long positions, leading to a shift in market balance toward sellers. The recent U.S. labor market data, which outperformed economists' expectations, is now a key factor for future Federal Reserve decisions, which are likely to be less sharp and unexpected. The central bank will likely take a more cautious stance on rate cuts, positively impacting the strength of the U.S. dollar. However, this doesn't negate the medium-term upward trend for the pair, and the lower the pair goes, the more attractive it becomes for buying. The COT report indicated that long non-commercial positions decreased by 9,522 to 178,273, while short non-commercial positions grew by 6,849 to 122,946. As a result, the gap between long and short positions increased by 2,700.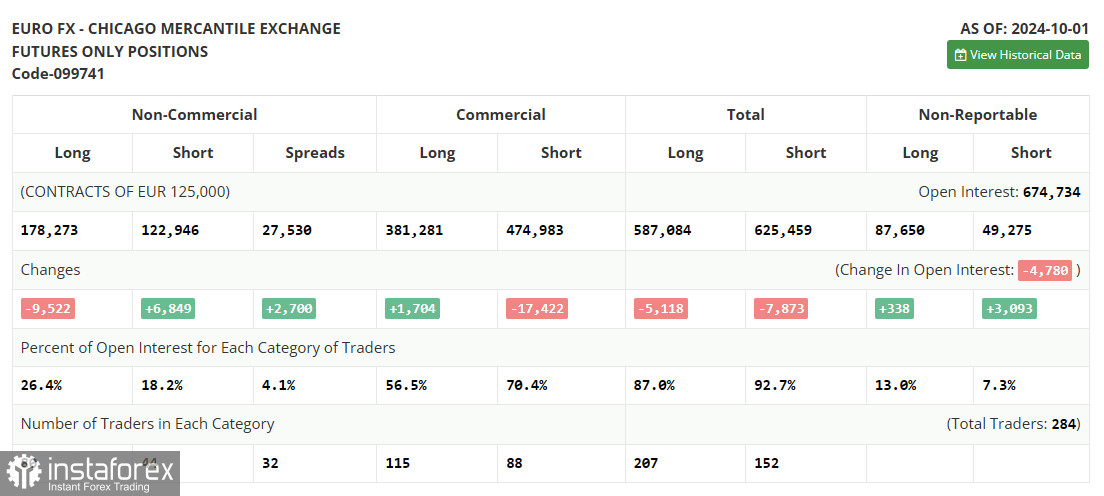
Indicator Signals:
Moving Averages:
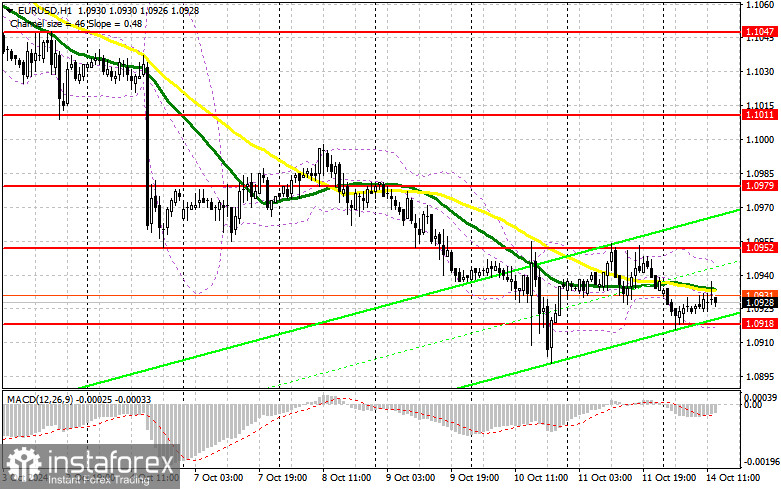
The pair is trading around the 30 and 50-day moving averages, indicating market uncertainty. Note: The moving averages discussed here are based on the hourly H1 chart and differ from the daily moving averages typically used on the D1 chart.
Bollinger Bands:
If the pair declines, the lower boundary of the Bollinger Bands near 1.0918 will act as support.
Indicator Descriptions:
- Moving Average: Smooths volatility and noise to define the current trend. Period 50, marked in yellow on the chart.
- Moving Average: Smooths volatility and noise to define the current trend. Period 30, marked in green on the chart.
- MACD Indicator: Moving Average Convergence/Divergence (MACD). Fast EMA period 12, Slow EMA period 26, SMA period 9.
- Bollinger Bands: Standard deviation channels. Period 20.
- Non-commercial traders: Speculators such as individual traders, hedge funds, and large institutions using the futures market for speculative purposes.
- Long non-commercial positions: The total long open positions held by non-commercial traders.
- Short non-commercial positions: The total short open positions held by non-commercial traders.
- Total non-commercial net position: The difference between short and long positions of non-commercial traders.


