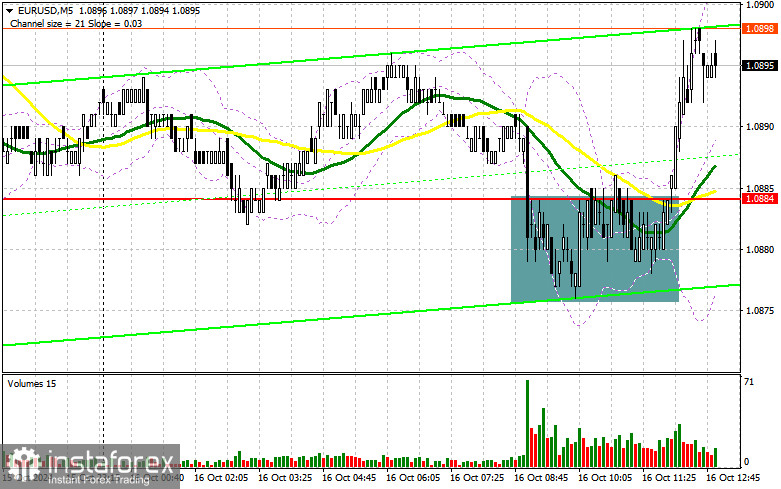
In my morning forecast, I focused on the 1.0884 level and planned to make entry decisions based on it. Let's take a look at the 5-minute chart and analyze what happened. The drop and the formation of a false breakout around the 1.0884 level provided an excellent entry point for buying the euro. This resulted in a rise of more than 15 poins, after which demand for the euro subsided. The technical picture has been revised for the second half of the day.

To Open Long Positions on EUR/USD:
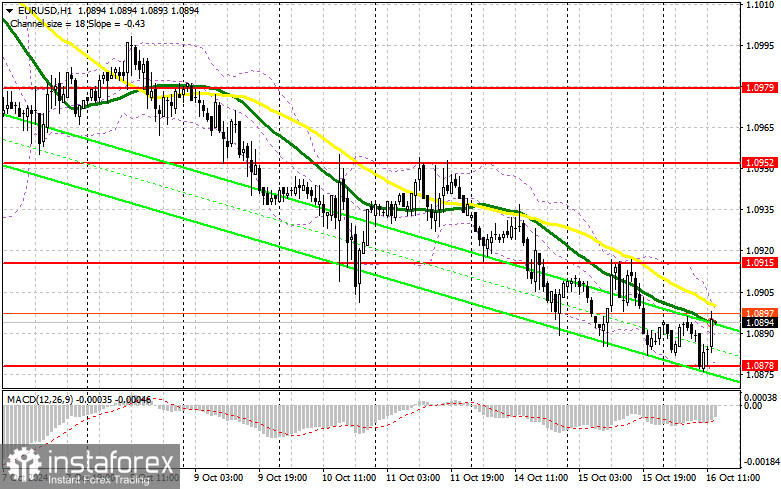
The absence of statistics from the eurozone helped buyers defend the 1.0884 support, though significant growth for the pair did not occur. Given that the only data release for the second half of the day is the U.S. Import Price Index, and with no statements expected from Federal Reserve representatives, the pair is likely to recover ahead of tomorrow's European Central Bank (ECB) meeting. If EUR/USD declines again, a false breakout around the newly formed support at 1.0878, formed in the first half of the day, will provide a good opportunity to increase long positions, opening the path toward 1.0915, which could not be breached yesterday. A breakout and retest of this range will confirm a solid buying entry point, aiming for retests of 1.0952 and 1.0979. The most distant target would be the 1.1011 high, where I will lock in profits. If EUR/USD declines further and there is no activity around 1.0878 in the second half of the day, pressure on the euro will likely remain within the overall trend. In this case, I will consider entering long positions only after a false breakout near the next support at 1.0853. I plan to open long positions around the 1.0830 level, aiming for an upward correction of 30-35 points within the day.
To Open Short Positions on EUR/USD:
Sellers attempted to push lower but, without support from major market participants, decided to retreat for now. Their "better times" may come with tomorrow's ECB meeting, so it's better not to rush into selling today and instead aim for higher levels. A false breakout around 1.0915, where the moving averages are positioned just below and favor sellers, will provide a good entry point for opening new short positions, targeting the 1.0878 support level. A breakout and consolidation below this range, followed by a retest from below, will provide another solid selling opportunity, targeting 1.0853, which will further strengthen the bearish market. I expect more active buying only at this level. The most distant target will be the 1.0830 level, where I will take profits. If EUR/USD rises in the second half of the day and no bearish activity is seen around 1.0915, buyers may gain a slight advantage. In this case, I will delay sales until the next resistance test at 1.0952. I will also sell there, but only after a failed consolidation attempt. I plan to open short positions immediately on a rebound from 1.0979, aiming for a downward correction of 30-35 points.

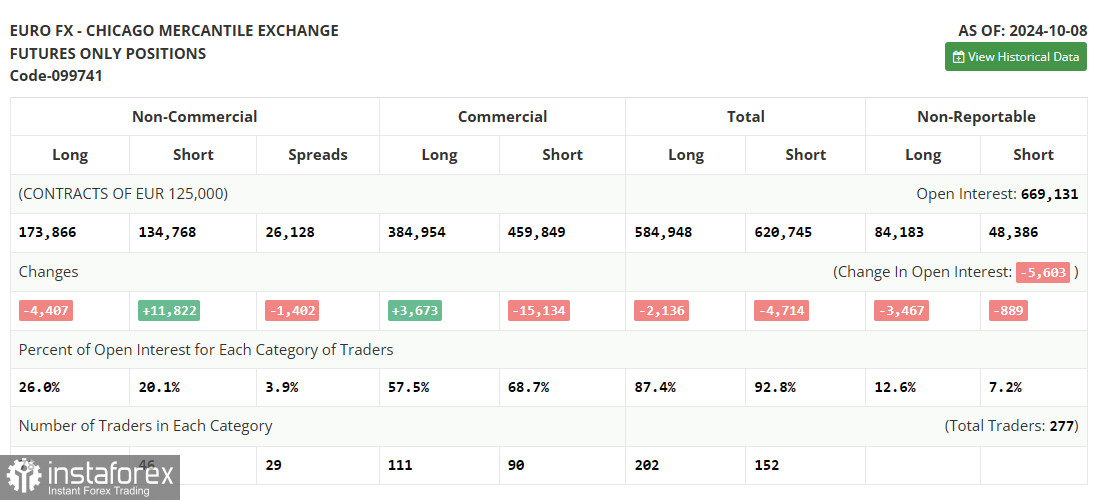
The COT Report (Commitment of Traders) for October 8 shows a sharp increase in short positions and a reduction in long positions. The report already reflects the latest U.S. labor market data but does not yet account for the inflation figures, which have likely led to further increases in short positions on the euro. So far, everything is favoring the U.S. dollar, and only strong European statistics, with several upcoming releases expected in the near term, can halt the bearish market for this trading instrument. However, this does not negate the medium-term uptrend for the pair, and the lower it goes, the more attractive it becomes for buyers. The COT report shows that long non-commercial positions decreased by 4,407, to 173,866, while short non-commercial positions grew by 11,822, to 134,768. As a result, the gap between long and short positions narrowed by 1,402.
Indicator signals:
Moving averages
Trading is conducted around the 30 and 50-day moving averages, which indicates market uncertainty.
Note: The period and prices of the moving averages are considered by the author on the hourly chart H1 and differs from the general definition of the classic daily moving averages on the daily chart D1.
Bollinger Bands
In case of a decline, the lower limit of the indicator around 1.0878 will act as support.
Description of the indicators
• Moving average (moving average, determines the current trend by smoothing volatility and noise). Period 50. It is marked in yellow on the chart.
• Moving average (moving average, determines the current trend by smoothing volatility and noise). Period 30. It is marked in green on the chart.
• MACD indicator (Moving Average Convergence/Divergence — convergence/divergence of moving averages) Fast EMA period 12. Slow EMA period 26. SMA period 9
• Bollinger Bands. Period 20
• Non-profit speculative traders, such as individual traders, hedge funds and large institutions that use the futures market for speculative purposes and meet certain requirements.
• Long non-commercial positions represent the total long open position of non-commercial traders.
• Short non-commercial positions represent the total short open position of non-commercial traders.
• The total non-commercial net position is the difference between the short and long positions of non-commercial traders.


