Analysis of EUR/USD 5M

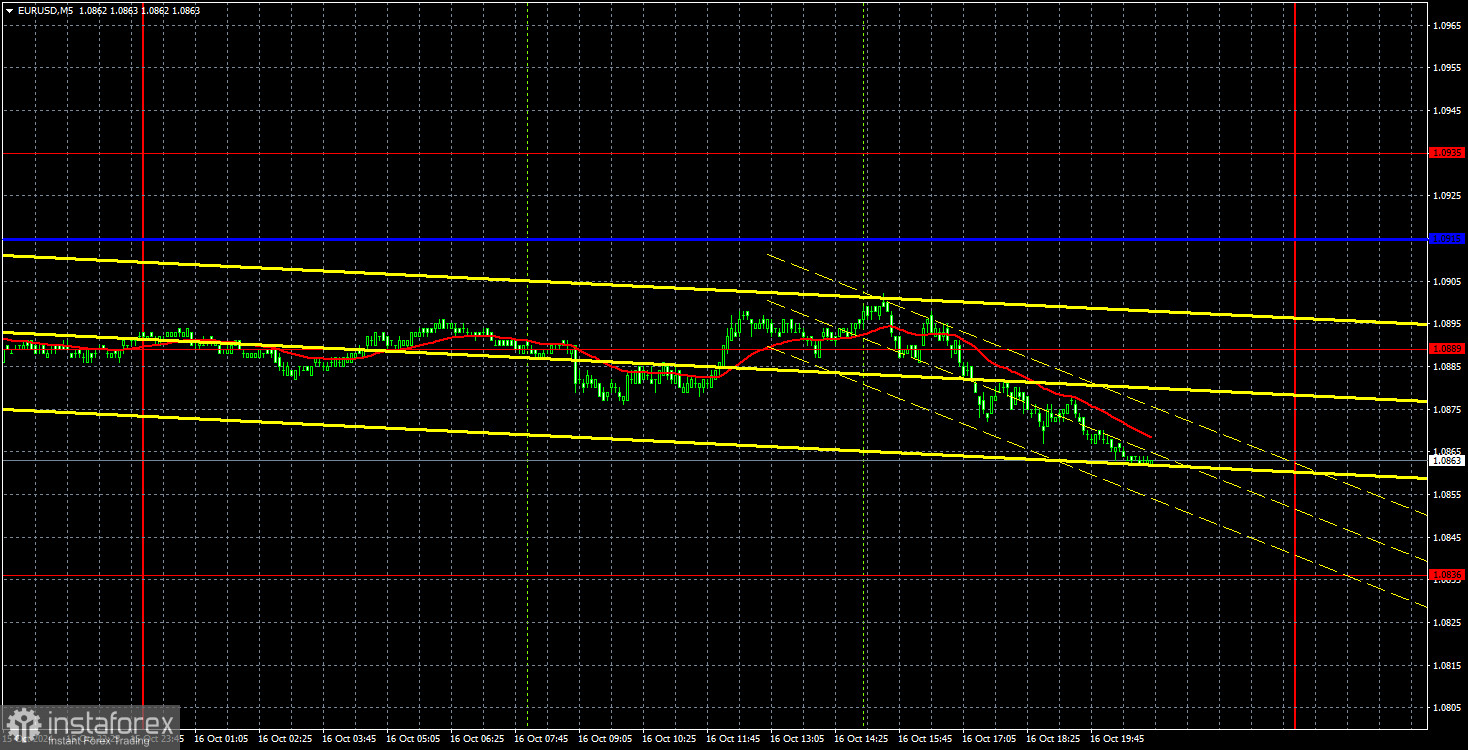
On Tuesday, the EUR/USD currency pair continued its near-freefall. We believe the nature of the current movement is very symbolic and accurately reflects the market sentiment. What does this daily decline in the euro mean? It signifies that market participants are selling the euro daily. Essentially, the euro is being sold for any reason, or no reason at all, just as the U.S. dollar was previously discarded. We repeatedly warned that the euro was overbought and unjustifiably expensive. We also warned that buying the euro simply because everyone else was doing it was illogical. We mentioned that there would come a time when the euro would fall daily, just as it had previously risen. Furthermore, we pointed out that the decline in the euro could start after September 18, when the Federal Reserve officially began its monetary easing. This is because the market had been pricing in the future rate cut from the Fed for two years, and once it started, there were no further factors to sell the dollar.
Thus, we now witness the daily decline of the euro, which could continue for a long time. Today, the European Central Bank will announce the results of its meeting, and no one doubts that rates will be cut for the third consecutive time, which means more aggressive easing than the Fed. However, the market had only been pricing in the Fed's rate cuts! Now, it must account for the ECB's cuts, which had been lower throughout the hawkish cycle.
Despite the pair's daily decline, it's challenging to capitalize on these moves in lower time frames due to low volatility. Therefore, trades must be held for several days or executed in higher time frames. The current movements are too weak for intraday trading. Most of the day is spent in a flat range, followed by a downward course for several hours.
COT Report:

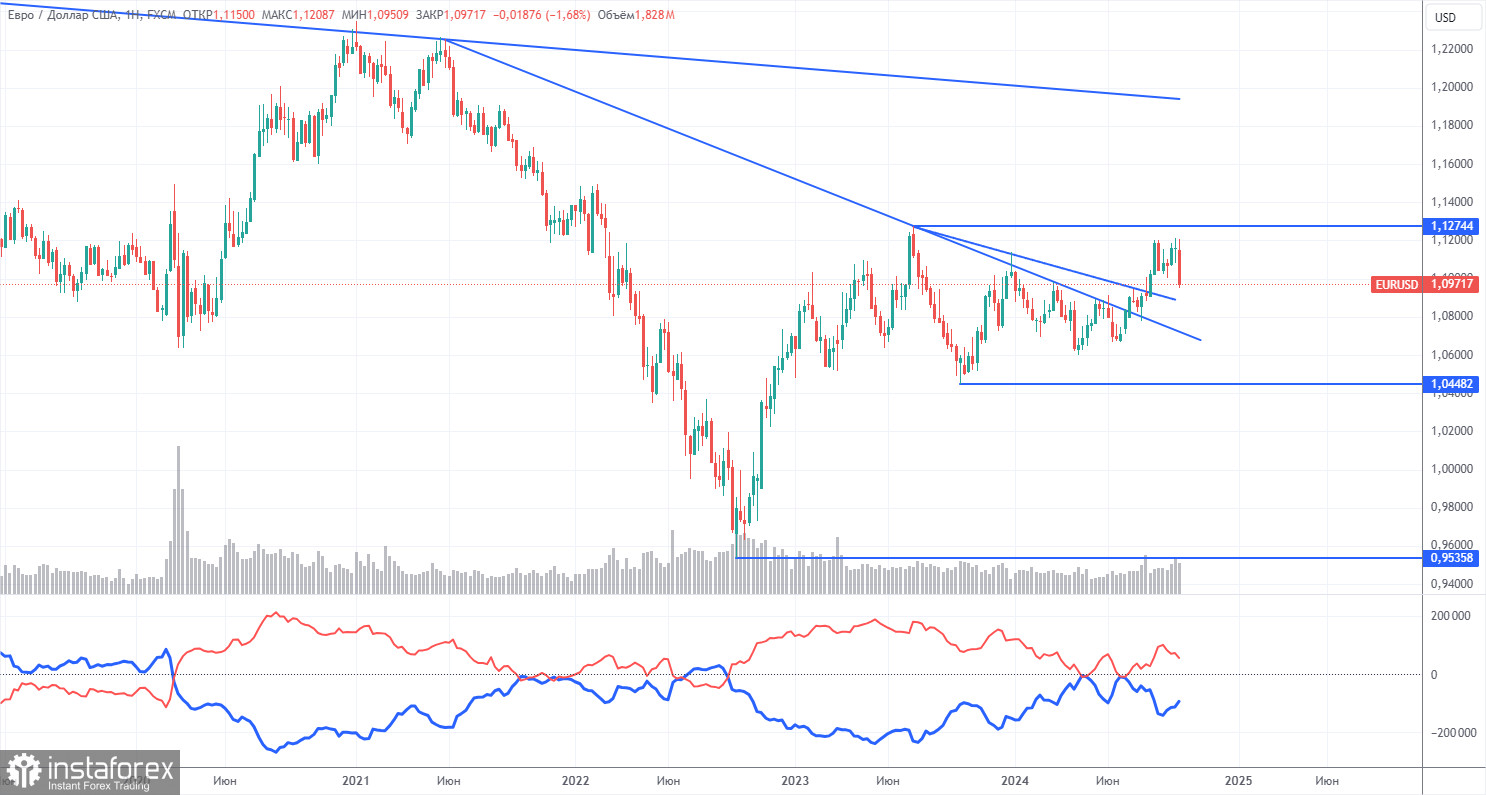
The latest COT report is dated October 1. As shown in the illustration, the net position of non-commercial traders has long been in the bullish zone. The bears' attempt to gain dominance failed spectacularly. The net position of non-commercial traders (red line) decreased in the second half of 2023 and early 2024, while commercial traders' (blue line) positions were growing. At the moment, professional traders are once again increasing their long positions.
We still don't see any fundamental factors supporting the strengthening of the euro, and technical analysis shows that the price remains in a consolidation zone or flat. On the weekly time frame, it's evident that since December 2022, the pair has been trading between levels 1.0448 and 1.1274. In other words, we have moved from a seven-month flat into an 18-month flat.
The red and blue lines are diverging, indicating an increase in long positions on the euro. However, within the context of a flat, such changes cannot form the basis for long-term conclusions. In the most recent reporting week, long positions for the non-commercial group decreased by 9,500, while short positions increased by 6,800. Accordingly, the net position fell by 16,300. The potential for a decline in the euro remains strong.
Analysis of EUR/USD 1H

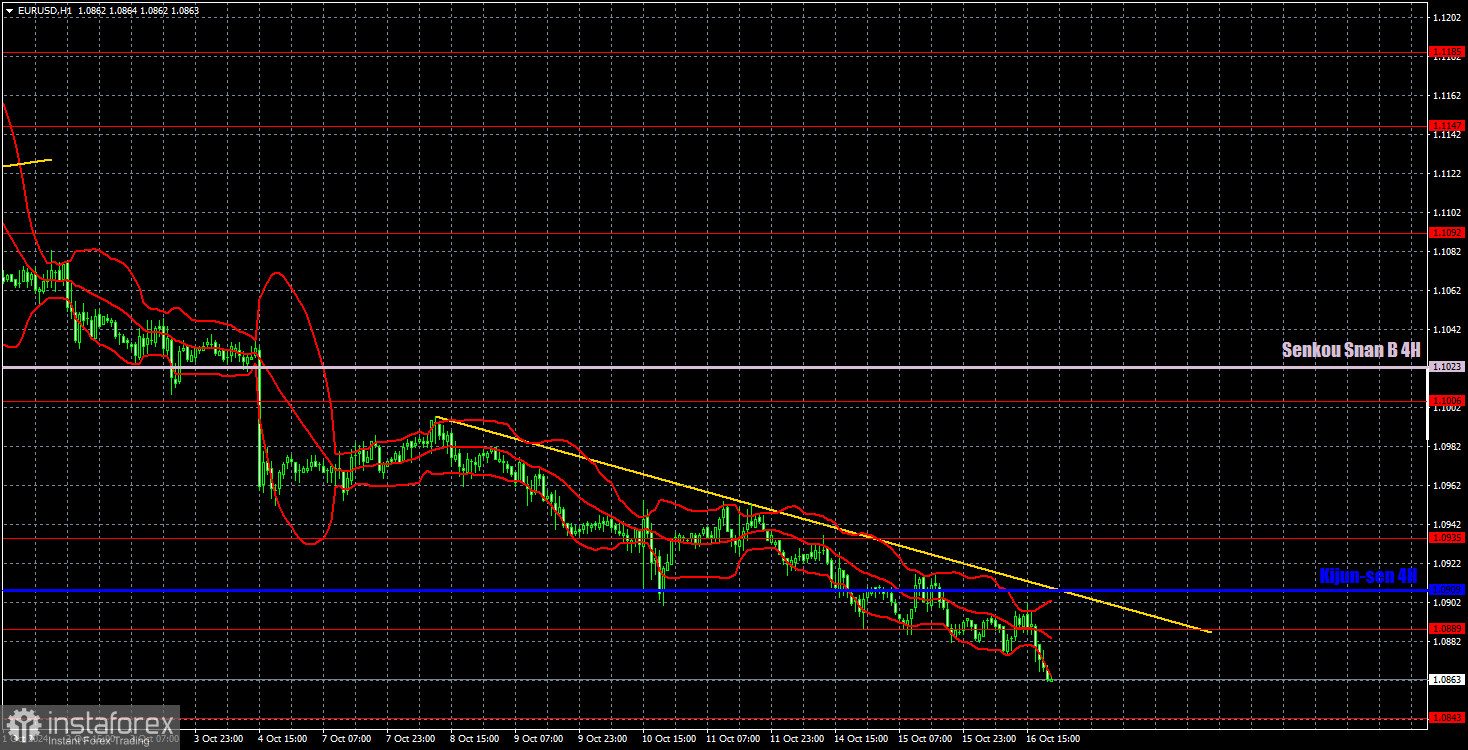
The pair continues its downward movement on the hourly time frame, which may begin a new long-term bearish trend. There's no point in discussing fundamental or macroeconomic reasons for a possible new dollar decline — they don't exist. In the medium term, we expect nothing but further decline. In the short term, a correction is possible, but for this to happen, the price needs to consolidate above the trend line.
For October 17, we highlight the following trading levels — 1.0658-1.0669, 1.0757, 1.0797, 1.0843, 1.0889, 1.0935, 1.1006, 1.1092, 1.1147, 1.1185, 1.1234, and also the Senkou Span B line (1.1083) and the Kijun-sen line (1.0942). The Ichimoku indicator lines may shift throughout the day, which should be considered when identifying trading signals. Don't forget to set a Stop Loss order to break even if the price moves 15 pips in the intended direction. This protects against potential losses if the signal turns out to be false.
The ECB meeting results will be announced, and a press conference with Christine Lagarde will follow. This is the day's most important event, and the future of the euro will depend on Lagarde's statements. In the U.S., less significant reports on retail sales, industrial production, and jobless claims will be published.
Explanation of Illustrations:
Support and Resistance Levels: Thick red lines near which price movement may end. They are not sources of trading signals.
Kijun-sen and Senkou Span B Lines: Ichimoku indicator lines transferred to the hourly time frame from the 4-hour chart. They are strong lines.
Extremes Levels: Thin red lines from which the price has previously bounced. They serve as sources of trading signals.
Yellow Lines: Trend lines, trend channels, and any other technical patterns.
Indicator 1 on COT charts: The size of the net position for each category of traders.


