


Analysis of Friday's Trades
1H Chart of the GBP/USD Pair
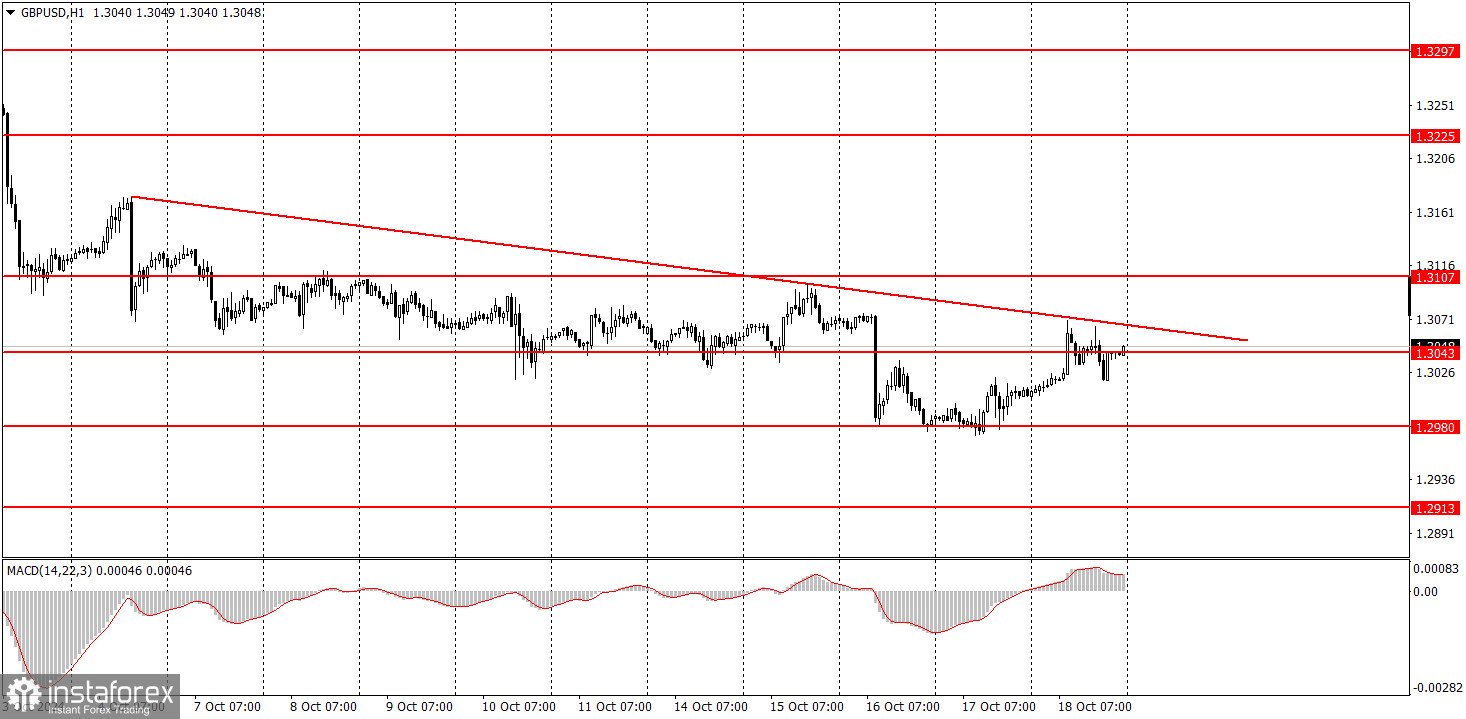
The GBP/USD pair continued to correct on Friday but remains below the trendline. Therefore, nothing changed on the last trading day of the week. Yes, the pound gained a bit more momentum due to the positive retail sales report in the UK, but we still cannot say that it is ready for a 200-300 pip rise. Moreover, we do not expect such a substantial correction, even if the price holds above the trendline. It should be remembered that the pound remains overbought and unjustifiably expensive even after three weeks of decline. The market has fewer and fewer reasons to sell the dollar, while the reasons to sell the pound are increasing. Market participants understand that the Bank of England will likely resume monetary policy easing soon since inflation in the UK has fallen below the target level.
5M Chart of the GBP/USD Pair
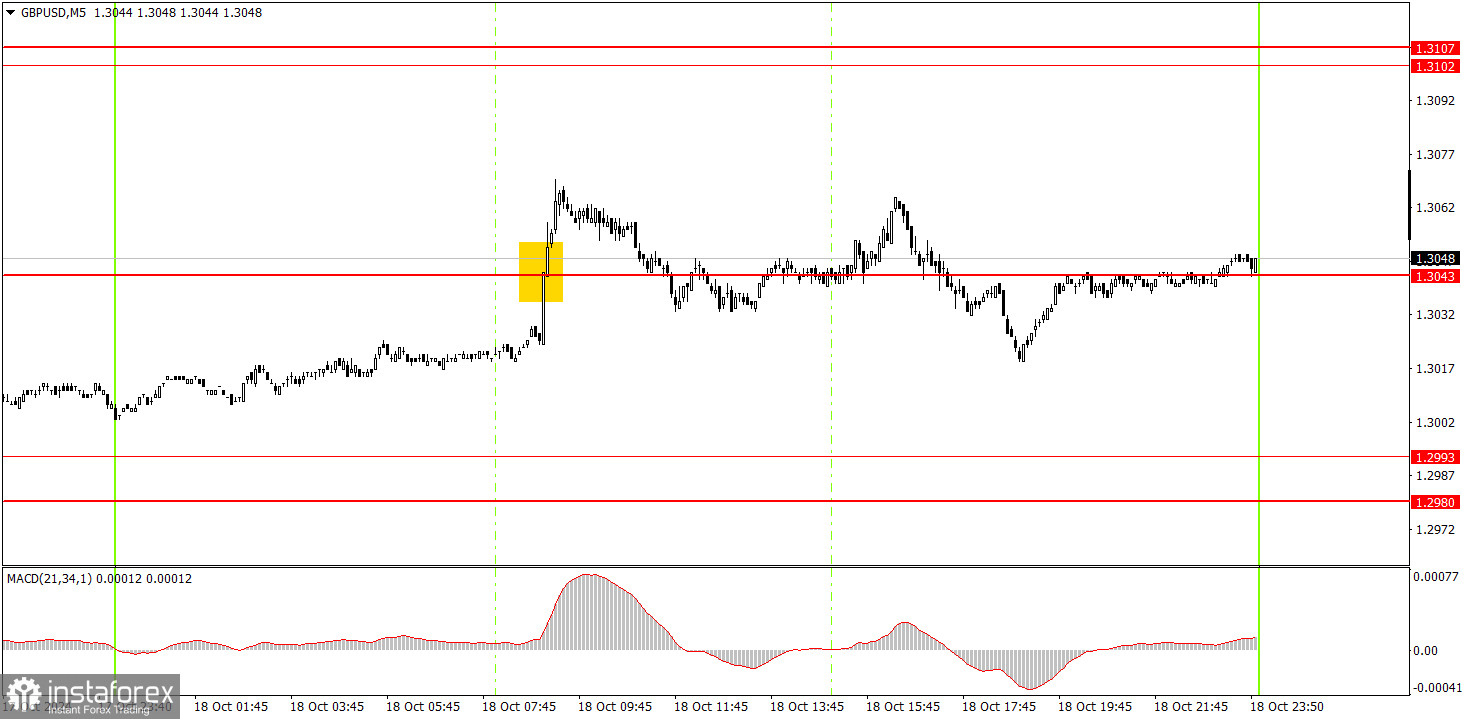
In the 5-minute time frame on Friday, many trading signals were generated around the 1.3043 level. The day's volatility was low again, totaling just 67 pips. Most of this volatility was driven by the retail sales report in the UK. Essentially, we saw a slight upward momentum after this report, and the pair remained flat for the rest of the day. The US reports caused a slight dollar strengthening but had little impact.
How to Trade on Monday:
In the hourly time frame, the GBP/USD pair has broken the uptrend and continues to decline. We fully support the pair's decline in the medium term, as we believe this is the only logical outcome. In the near term, the pound may attempt to correct, but for this to happen, it needs to at least consolidate above the trendline. In any case, with the current low volatility, expecting an intense and rapid rise is unlikely.
On Monday, the pair may resume its downward movement, as the trendline has not remained intact. Discussing buying positions is pointless as long as the price stays below the trendline. And even if a breakout occurs, it will likely only be a correction.
In the 5-minute time frame, trading can currently be conducted around the levels 1.2848-1.2860, 1.2913, 1.2980-1.2993, 1.3043, 1.3102-1.3107, 1.3145-1.3167, 1.3225, 1.3272, 1.3365, 1.3428-1.3440. On Monday, no significant events are scheduled in the UK or the US. As a result, volatility may decrease further, and the price may slowly "slide" through the trendline.
Basic Rules of the Trading System:
- The strength of a signal is determined by the time it takes to form (bounce or break through a level). The less time it takes, the stronger the signal.
- If two or more trades were opened with false signals around a certain level, all subsequent signals from that level should be ignored.
- In a flat market, any pair can generate many false signals or none at all. In any case, it's better to stop trading at the first signs of a flat market.
- Trading should be done between the start of the European session and the middle of the American session, after which all trades should be closed manually.
- On the hourly time frame, trade signals from the MACD indicator are best used when there is good volatility and a trend confirmed by a trendline or channel.
- If two levels are too close to each other (5 to 20 pips apart), consider them as a support or resistance zone.
- When the price moves 20 pips in the intended direction, set a Stop Loss to break even.
What's on the Charts:
Support and Resistance Price Levels: These levels serve as targets when opening buy or sell positions. They can also be used as points to set Take Profit levels.
Red Lines: These represent channels or trend lines that display the current trend and indicate the preferred trading direction.
MACD Indicator (14,22,3): The histogram and signal line serve as a supplementary indicator that can also be used as a source of trading signals.
Important Speeches and Reports (always found in the news calendar) can significantly impact the movement of a currency pair. Therefore, trading should be done with maximum caution during their release, or you may choose to exit the market to avoid a sharp price reversal against the preceding movement.
For Beginners Trading on the Forex Market: It's essential to remember that not every trade will be profitable. Developing a clear strategy and practicing money management is key to achieving long-term success in trading.


