


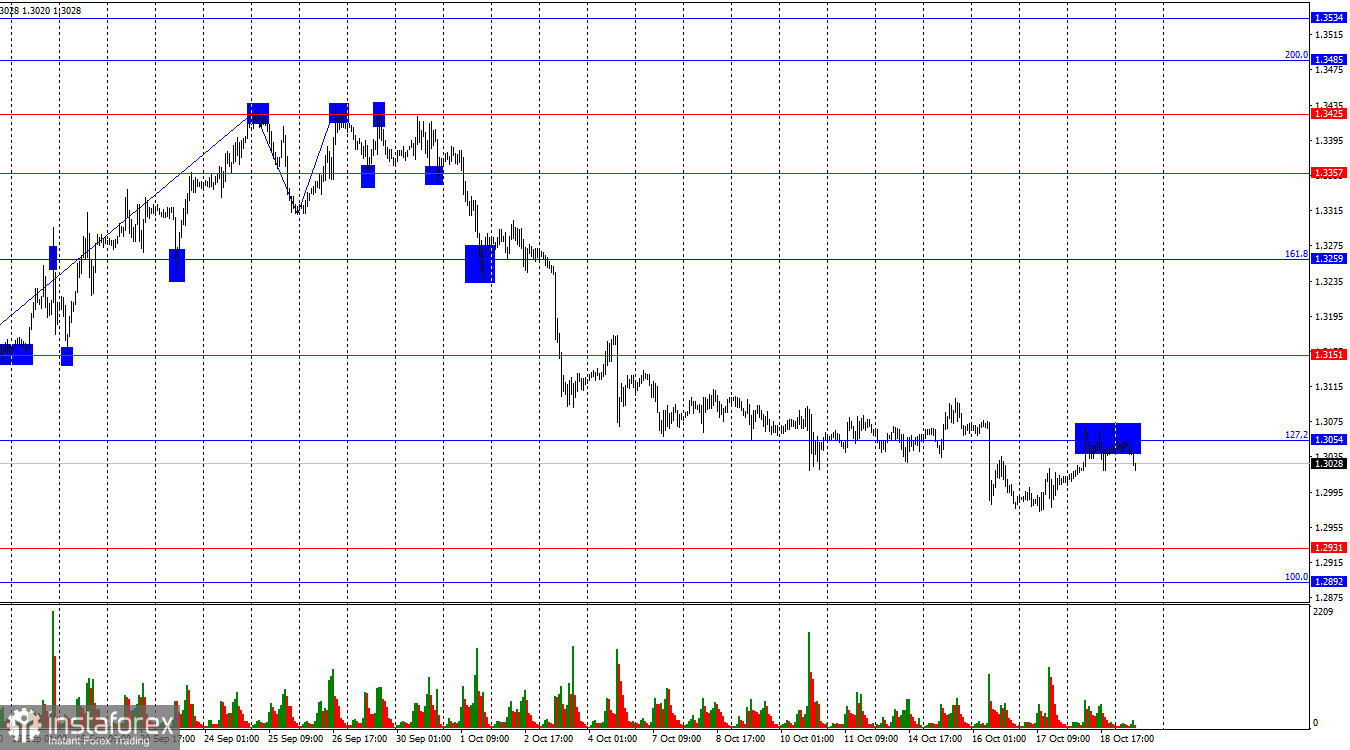
On the hourly chart, the GBP/USD pair made several attempts on Friday to consolidate above the nearest corrective level of 127.2% at 1.3054. All attempts failed. Thus, the decline in quotes may resume this week towards the support zone of 1.2892–1.2931. Consolidation above the 1.3054 level on the fourth attempt could trigger a rise in the pound, with the first target at 1.3151.
The situation with the waves raises no concerns. The last completed upward wave (September 26) did not exceed the peak of the previous wave, while the downward wave, which has been forming for 17 days, easily broke the low of the previous wave at 1.3311. Therefore, the "bullish" trend is currently considered complete, and a "bearish" trend has begun. A corrective upward wave can be expected from the 1.2931 level, but technical signals need to form first.
On Friday, the pound received support from the UK retail sales report, which showed a 0.3% increase compared to traders' expectations of -0.3% m/m. This temporarily halted the continuous selling of the British pound by the bears. In the afternoon, the U.S. released a report on building permits, which came in below market expectations, while the number of housing starts met forecasts. The slightly worse-than-expected U.S. data prevented the dollar from resuming its growth on Friday. However, as we can see, Monday has already started with bear attacks. Few significant reports are expected from the UK this week, and those that are likely will not provide much support for the bulls. I believe that the bulls have become exhausted, and the pound may only strengthen if selling pressure eases. But for now, the bears have no reason to retreat, and no significant events or signals for long positions are present.
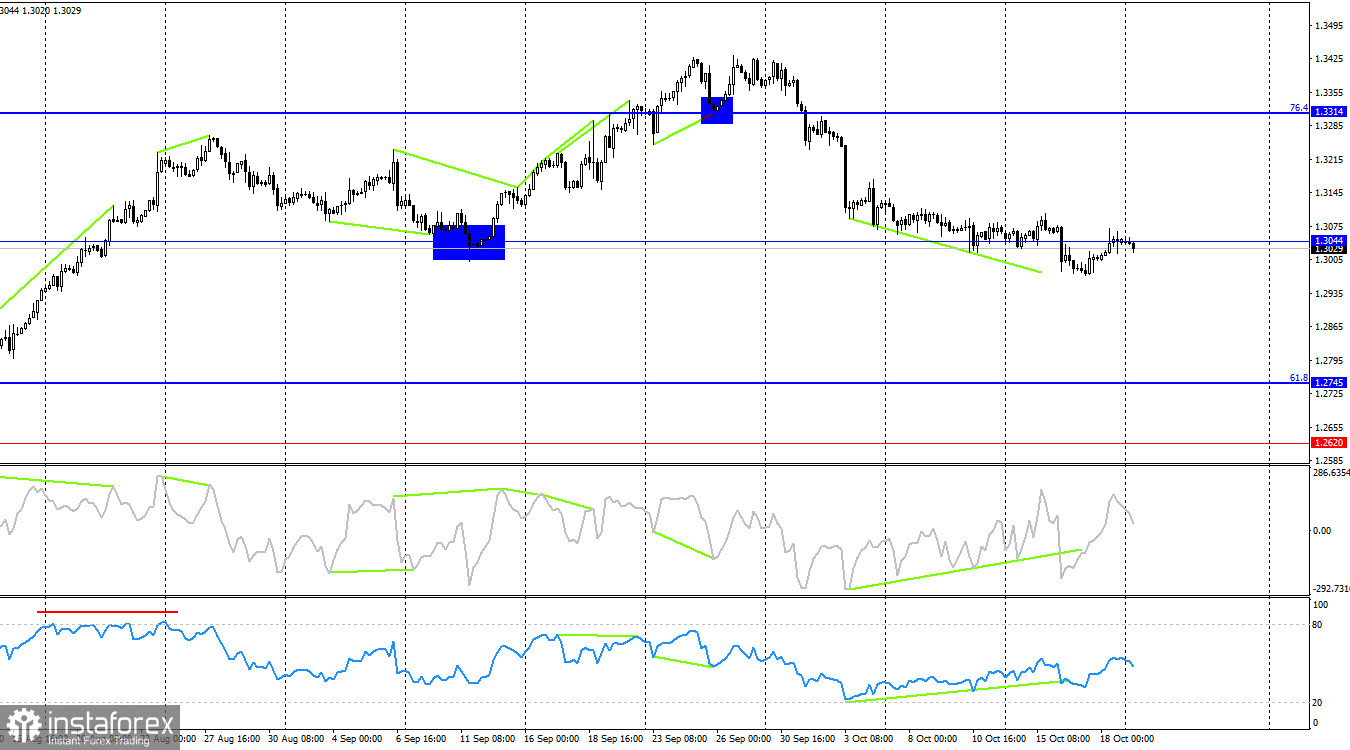
On the 4-hour chart, the pair consolidated below the corrective level of 1.3044, suggesting further decline towards the next corrective level of 61.8% at 1.2745. For over a week, a "bullish" divergence has been developing on both indicators, indicating a potential rebound from the 1.3044 level. However, the rebound did not occur. After that, the bulls failed to close above this level. The bears indicate that the trend has shifted downward, thus ignoring the "bullish" divergences. A correction is expected, but it will likely occur later.
Commitments of Traders (COT) Report
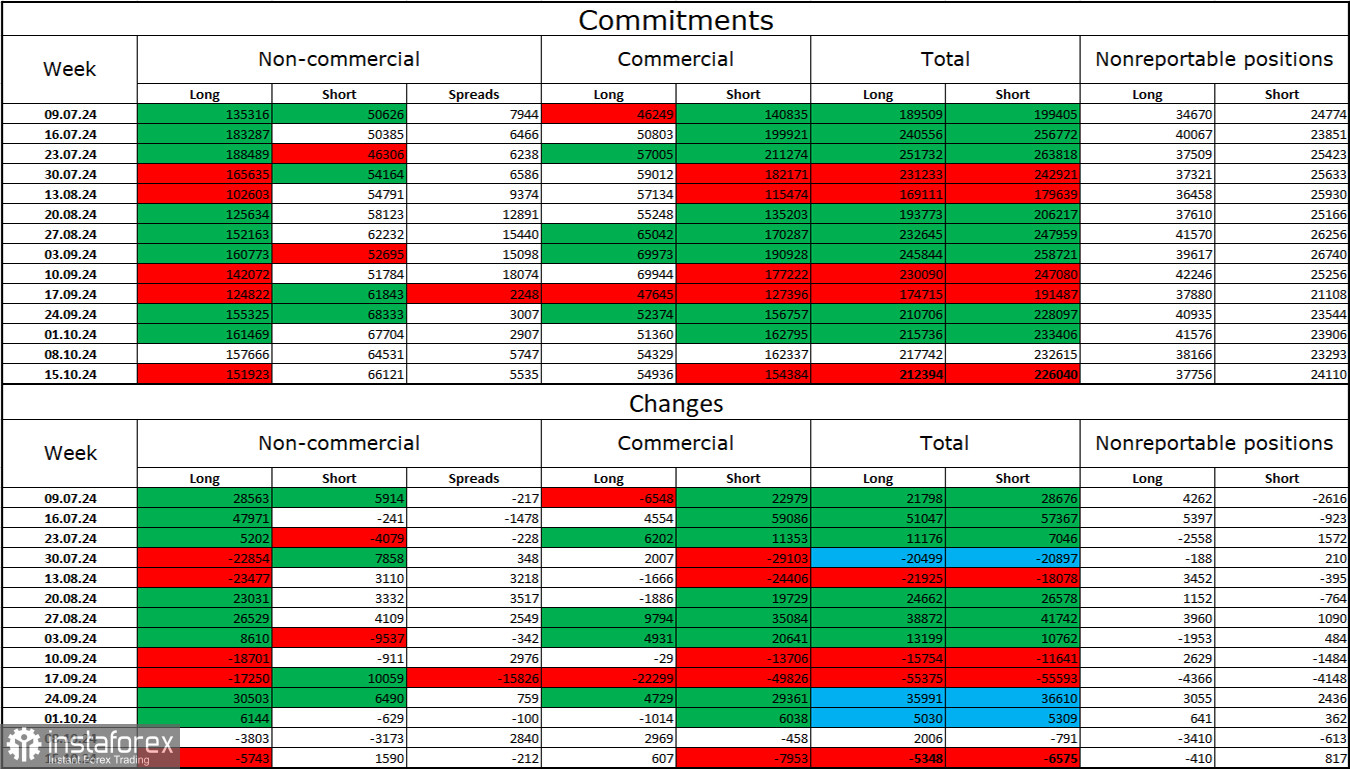
The sentiment of the "Non-commercial" traders remained "strongly bullish" during the last reporting week. The number of long positions held by speculators decreased by 5,743, while the number of short positions increased by 1,590. The bulls still have a solid advantage, with a gap between the number of long and short positions of 86,000: 152,000 versus 66,000.
In my opinion, the pound still faces prospects for further decline, but the COT reports suggest otherwise. Over the past three months, the number of long positions has increased from 135,000 to 152,000, while short positions have grown from 50,000 to 66,000. I believe that, over time, professional traders will start reducing long positions or increasing short positions, as all potential factors for buying the British pound have already been factored in. The graphical analysis suggests that this process may begin soon (or may have already started, judging by the wave formations).
News Calendar for the U.S. and the UK
On Monday, the economic events calendar contains no significant entries. No significant news releases are expected to impact market sentiment today.
GBP/USD Forecast and Trading Tips
Selling opportunities emerged after the pair rebounded on the hourly chart from the 1.3425 level, with targets at 1.3357, 1.3259, 1.3151, and 1.3054. All targets have been met. New short positions could have been opened after closing below 1.3044 on the 4-hour chart, with a target of 1.2931. I currently do not see any potential signals for buying.
Fibonacci Levels
Levels are plotted between 1.2892–1.2298 on the hourly chart and between 1.4248–1.0404 on the 4-hour chart.


