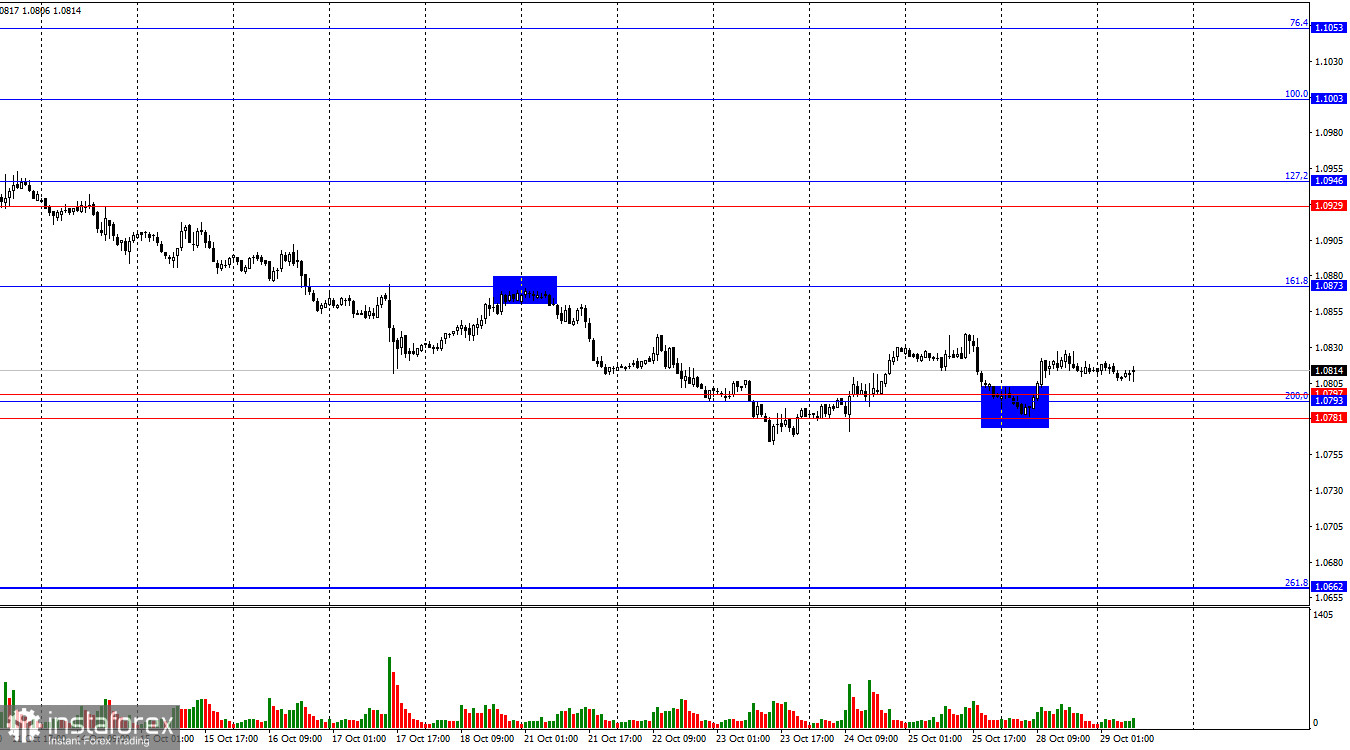
On Monday, the EUR/USD pair began moving back toward the support zone of 1.0781–1.0797. A new rebound from this area could trigger a reversal in favor of the euro and renew a very weak upward movement toward the 161.8% Fibonacci retracement level at 1.0873. However, keep in mind that the bulls are currently very weak, and without significant fundamental support, they are unlikely to mount a full-fledged attack.

The current wave structure is clear. The last completed upward wave (September 25-30) did not exceed the previous wave's peak, while the new downward wave (still forming) broke through the lows of the previous three waves. Thus, the pair is currently forming a new bearish trend, beginning with its first wave. A corrective wave may appear soon, but the bulls have lost market initiative. It would take considerable effort to regain it, which seems unlikely anytime soon.
There was no news on Monday. Today, traders will focus on the U.S. JOLTS report, which shows the number of job openings. If the September reading falls below market expectations, bullish traders could see renewed buying interest. However, the fundamental backdrop will be far more extensive and influential on other days this week. Traders may choose to wait for Wednesday, Thursday, and Friday to initiate active trades. The euro faces continued pressure due to the monetary policies of the Federal Reserve and the European Central Bank (ECB). The market has already priced in the most dovish FOMC easing scenarios, turning attention toward the ECB's next moves. Technical analysis indicates that even strong support zones have not sparked significant growth. Therefore, this week's news will likely determine the pair's direction, and a close below the 1.0781–1.0797 zone should be taken seriously.

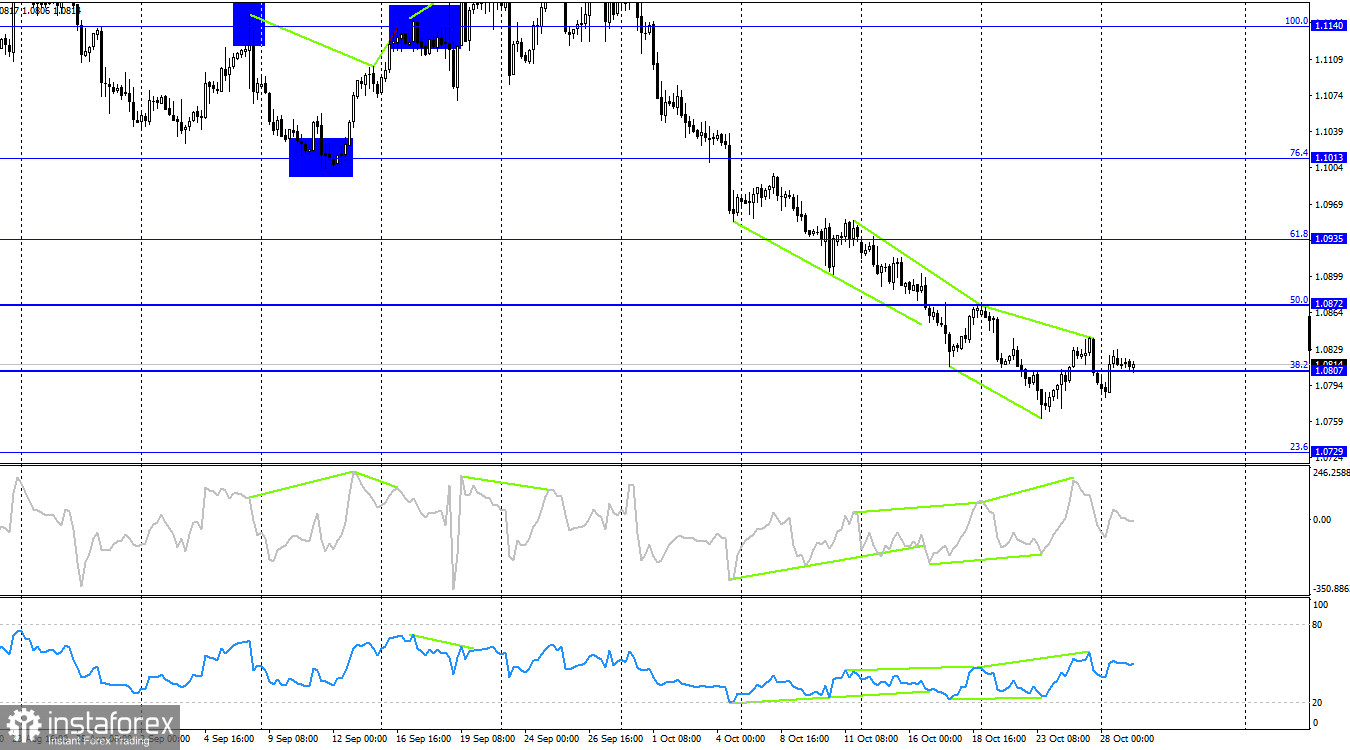
On the 4-hour chart, the pair reversed in favor of the euro following another bullish divergence, though the rise was short-lived. On Friday, bearish divergences appeared on both indicators, signaling potential declines toward the 23.6% Fibonacci retracement level at 1.0807. Additionally, the support zone on the hourly chart remains crucial. Bulls and bears are in a tug-of-war within a narrow range, awaiting significant news from the EU and the U.S. I believe the probability of another decline remains much higher than that of an upward movement.
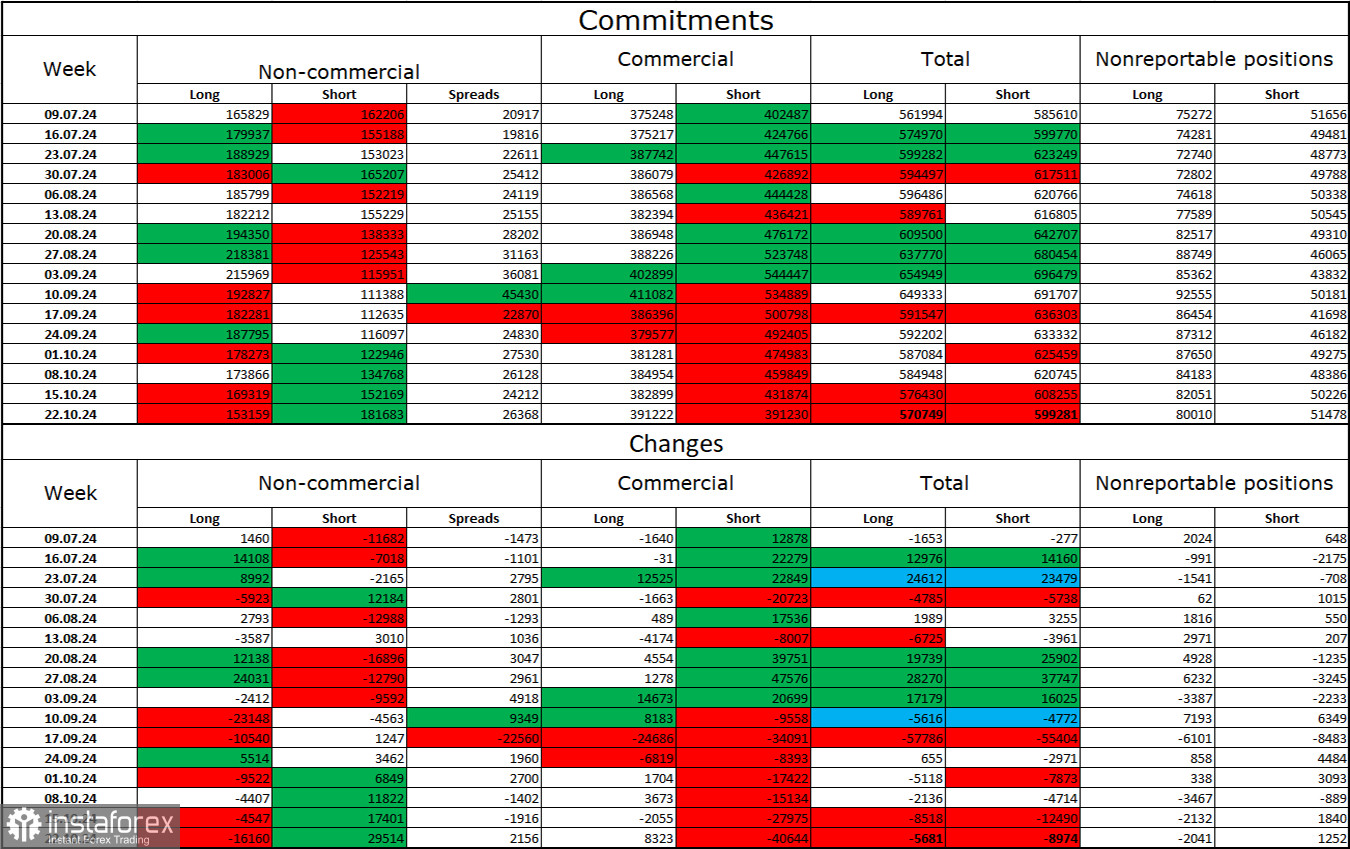
Commitments of Traders (COT) Report:

During the last reporting week, speculators closed 16,160 long positions and opened 29,514 short positions. The sentiment of the "Non-commercial" group turned bearish. The total number of long positions held by speculators is now 153,000, while short positions total 181,000.
For the seventh consecutive week, large investors have increasingly reduced their euro positions. In my opinion, this may signal a new bearish trend or at least a substantial global correction. The primary reason for the dollar's decline—expectations of FOMC policy easing—has already been accounted for, leaving the market with little reason to sell off the dollar en masse. While new reasons could arise over time, the dollar's growth is currently more likely. Technical analysis also suggests the start of a bearish trend, leading to expectations of a prolonged decline in the EUR/USD pair.
News Calendar for the U.S. and Eurozone:
U.S. – JOLTS Job Openings Change (14:00 UTC)
October 29 features only one economic event in the calendar, which traders will need to focus on entirely. The impact of the news on market sentiment for the day is expected to be mild.
EUR/USD Forecast and Trading Tips:
Selling the pair is possible upon a close below the 1.0781–1.0797 zone on the hourly chart, with a target of 1.0729. Buying the pair is an option if there's a rebound from the 1.0781–1.0797 zone, aiming for 1.0873. However, until Wednesday, trading activity may be subdued due to limited news. Bullish positions remain weak by default.
Fibonacci retracement levels are drawn between 1.1003 and 1.1214 on the hourly chart, and between 1.1139 and 1.0603 on the 4-hour chart.


