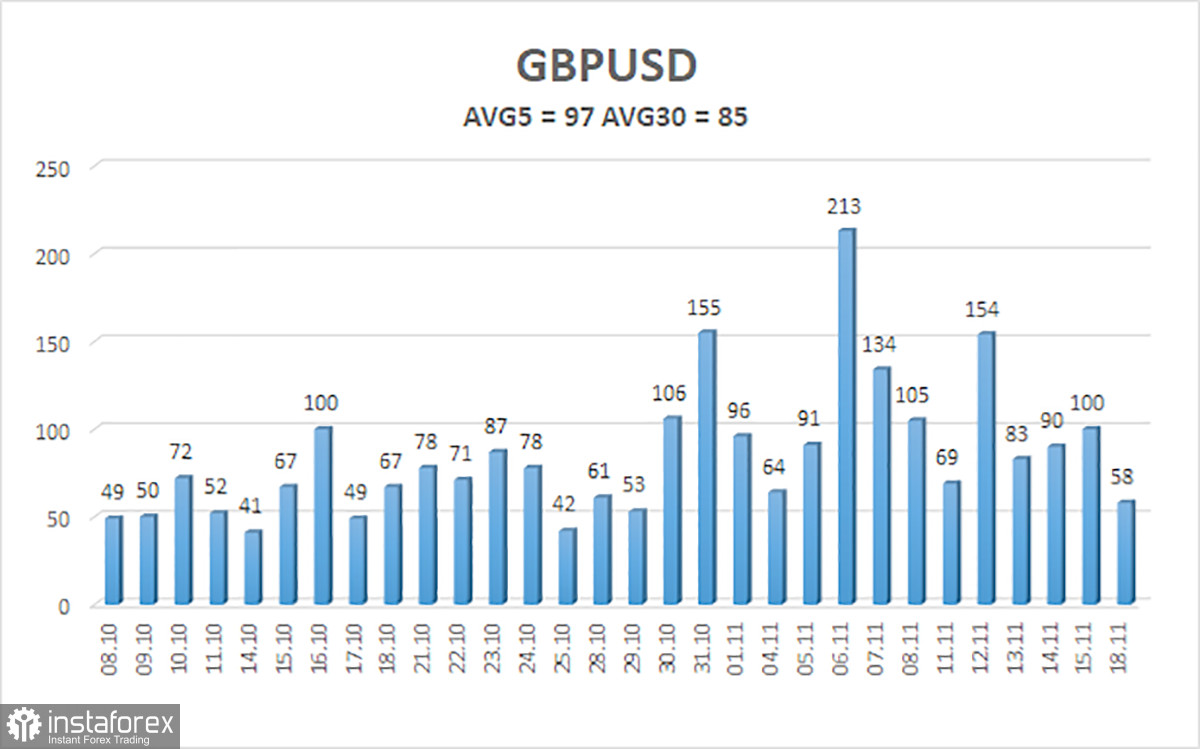
The GBP/USD pair showed little inclination for significant movement on Monday, marking a rare calm day in recent months. While the session was relatively uneventful, the British pound's volatility has increased in recent weeks. This is a positive development for intraday traders, as it allows for more profitable trading opportunities based on local signals. When daily price movements are limited to 50 pips, achieving profitability becomes challenging. However, the pair now regularly moves about 100 pips daily.
The outlook for the British pound remains vague. Despite the pair's decline over the past 1.5–2 months, it has been relatively moderate. Many factors contributing to the euro's decline, discussed in the EUR/USD analysis, also apply to the pound. The only exception may be the trade war since the United States and Britain are on friendly terms, and Donald Trump does not believe that the British are using his country for their benefit. However, simultaneously, the British currency has the factor of the Bank of England's slowness.
The BoE is proceeding very cautiously with rate cuts. The central bank anticipates significant inflation acceleration this year and expects inflation to remain above target in 2025. Thus, it is reasonable that the British central bank is slowly lowering the rate. This slow rate-cutting process has helped limit the pound's decline.
The pound may enter freefall if or when the BoE begins cutting rates at every meeting—or signals readiness for more dovish measures. It remains overbought and unjustifiably expensive, with its growth over the past two years being merely a correction within a 16-year-long bearish trend. While every trend eventually ends, the pound's 2024 rally was illogical and failed to reach levels that would indicate the end of the bearish trend.
There is no evidence to suggest that the 16-year trend has concluded. The fundamental background continues to point to the dollar's growth. The British economy is weak and only pretends to grow. The BoE can expect its growth to double next year, but it is not a fact that this will happen. The rate cut would only fuel traders' interest in selling British currency.
From a technical perspective, the pound, like the euro, cannot sustain levels above the moving average. This week, the pound may receive a boost from the UK's inflation report, but the impact remains uncertain as the report's outcome is unknown.

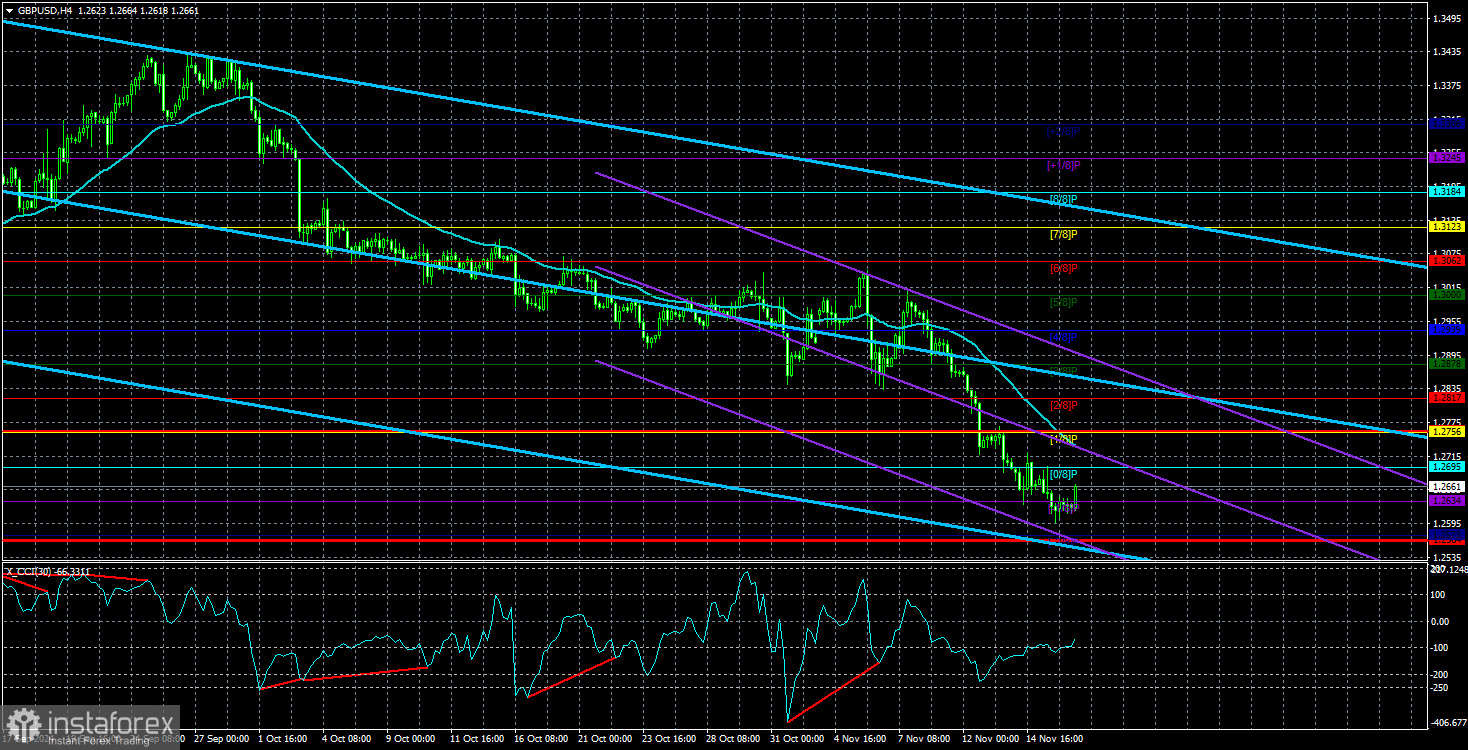
The average GBP/USD pair volatility for the last five trading days is 97 pips. This value is "average" for the GBP/USD pair. On Tuesday, November 19, we expect movement inside the range bounded by the levels of 1.2564 and 1.2758. The higher linear regression channel has turned downward, which signals a downtrend. The CCI indicator has many bullish divergences and also entered the oversold area several times, but we did not see any corrections.
Support Levels:
S1: 1.2634
S2: 1.2573
Resistance Levels:
R1: 1.2695
R2: 1.2756
R3: 1.2817
Trading Recommendations:
The GBP/USD pair maintains its downtrend. Long positions are not recommended as the market has already priced the pound's growth factors. If trading is based purely on technical analysis, long positions may be considered above the moving average, with targets at 1.2817 and 1.2878. Short positions are far more relevant, with targets at 1.2573 and 1.2564, as long as the price remains below the moving average.
Explanation of Illustrations:
Linear Regression Channels help determine the current trend. If both channels are aligned, it indicates a strong trend.
Moving Average Line (settings: 20,0, smoothed) defines the short-term trend and guides the trading direction.
Murray Levels act as target levels for movements and corrections.
Volatility Levels (red lines) represent the likely price range for the pair over the next 24 hours based on current volatility readings.
CCI Indicator: If it enters the oversold region (below -250) or overbought region (above +250), it signals an impending trend reversal in the opposite direction.


