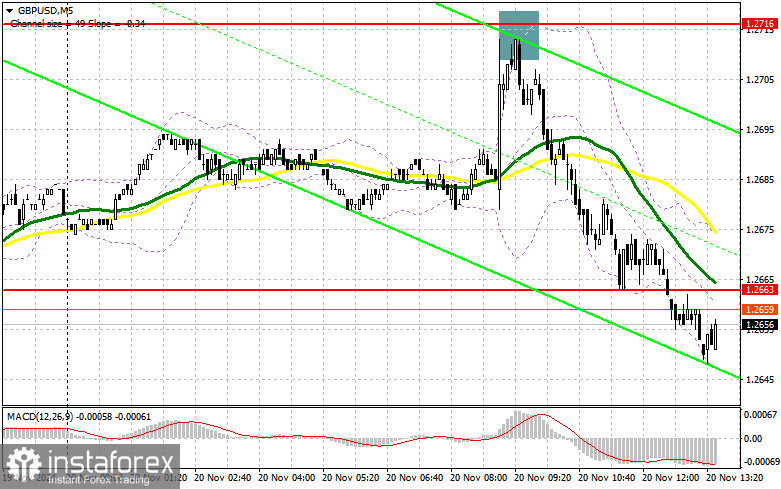
In my morning forecast, I highlighted the 1.2761 level as a key point for making market entry decisions. Let us review the 5-minute chart to analyze the developments. The price increased, forming a false breakout that provided an entry point to sell the pound, leading to a decline of more than 50 points. The technical outlook has been revised for the second half of the day.

For Opening Long Positions in GBP/USD:
Inflation in the UK continues to be a concern for both economists and consumers. According to the latest data, inflation has reached new highs, surpassing expert forecasts. This development is likely to push UK policymakers to reconsider their strategies and compel the Bank of England to take a more aggressive stance, which caused the pound to rise earlier in the day.
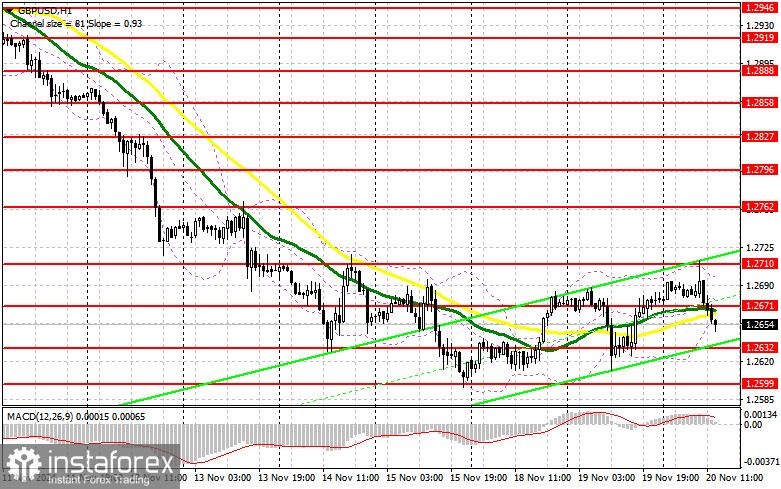
During the US session, pressure on the pound may persist as speeches from FOMC members Michael S. Barr and Michelle Bowman are expected. Any dovish comments on Fed policy could increase demand for the US dollar. In this scenario, a decline and a false breakout near the 1.2632 support level would validate a long position entry, aiming for a recovery toward the resistance formed earlier in the day. A breakout and retest of this range could provide an additional entry point for long positions, targeting 1.2710. The ultimate target would be 1.2762, where I plan to take profits.
If GBP/USD continues to decline and no buyer activity is observed near 1.2632, bears may push the pair toward the monthly low. In this case, a false breakout near 1.2599 would provide a suitable condition for entering long positions. Alternatively, I would buy on a rebound from 1.2560, targeting a 30-35 point correction.
For Opening Short Positions in GBP/USD:
Despite the renewed pressure on the pair, I will avoid rushing into sales near the monthly low. It is preferable to wait for the pair to rise and for bearish activity to develop near the 1.2671 resistance level, where the moving averages also favor sellers. A false breakout at 1.2671 would provide a suitable selling opportunity, targeting a decline toward the 1.2632 support level.
A breakout and retest of this level from below could further weaken the bulls' positions, triggering stop-loss orders and paving the way for a drop to the monthly low of 1.2599. The ultimate target would be 1.2560, where I plan to take profits.
If GBP/USD moves higher during the US session while disregarding Fed remarks, buyers may attempt to initiate a more significant correction. In this case, I will wait to sell until the next resistance at 1.2710 is tested, entering short positions only after a failed breakout. I would also consider short positions on a rebound from 1.2762, aiming for a 30-35 point downward correction.

COT Report (Commitment of Traders) Review:
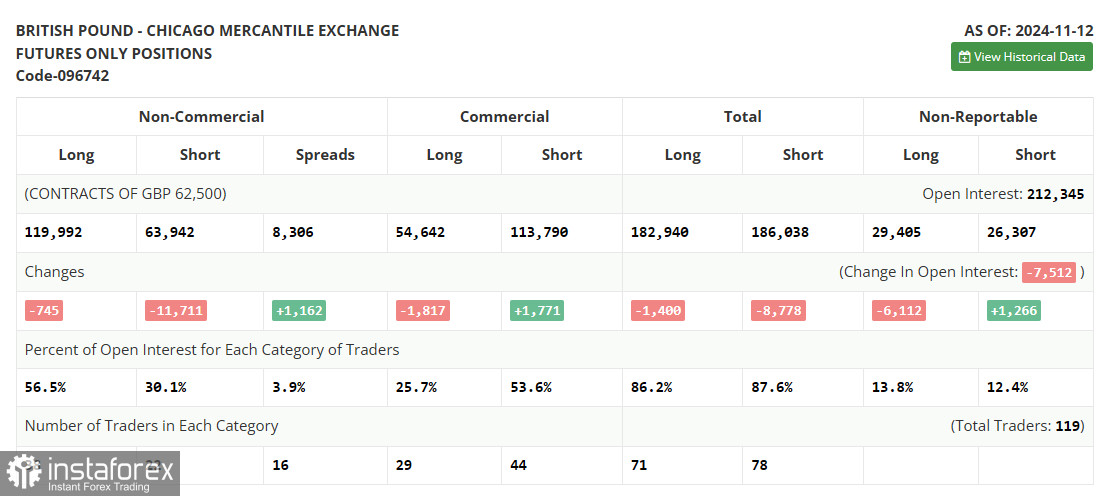
The COT report for November 12 indicated a modest decrease in both long and short positions. This reflects the Bank of England's recent rate cut and developments under Donald Trump's presidency. The sharp decline in short positions suggests that fewer traders are willing to sell at current levels. However, the lack of buyers for the pound indicates that a major correction is unlikely in the near term.
The report showed that non-commercial long positions fell by 745 to 119,992, while short positions declined by 11,711 to 63,942. Consequently, the gap between long and short positions widened by 1,162.

Indicator Signals:
- Moving Averages: The pair is trading near the 30- and 50-day moving averages, indicating a range-bound market.Note: These averages are based on the H1 chart and may differ from classic daily averages (D1).
- Bollinger Bands: The lower boundary of the Bollinger Bands near 1.2650 will act as support if the pair declines.
Indicator Descriptions:
- Moving Average (MA): Identifies the current trend by smoothing volatility and noise.
- Period: 50, marked in yellow on the chart.
- Period: 30, marked in green on the chart.
- MACD (Moving Average Convergence/Divergence):
- Fast EMA: Period 12
- Slow EMA: Period 26
- SMA: Period 9
- Bollinger Bands:
- Period: 20
- Non-commercial traders: Speculators such as individual traders, hedge funds, and large institutions using the futures market for speculative purposes.
- Long non-commercial positions: The total open long positions held by non-commercial traders.
- Short non-commercial positions: The total open short positions held by non-commercial traders.
- Net non-commercial position: The difference between short and long positions held by non-commercial traders.


