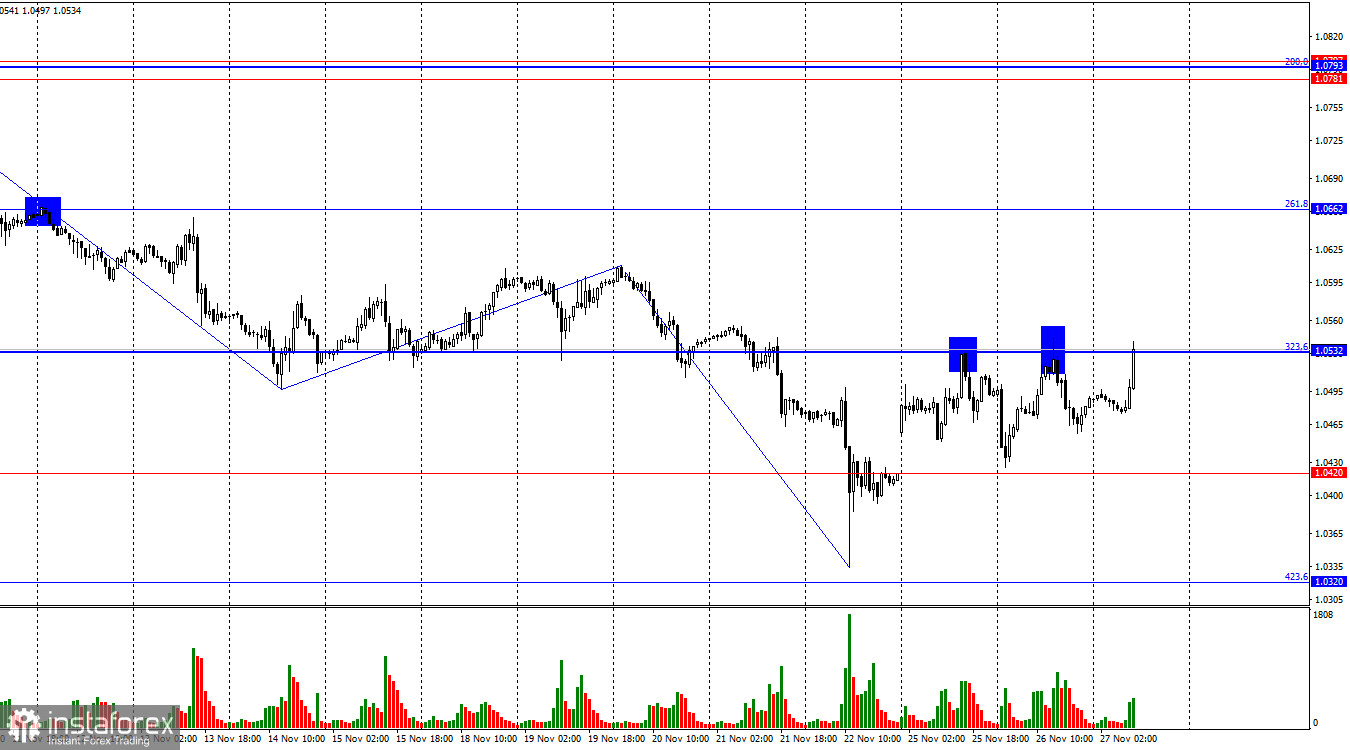
On Wednesday, the EUR/USD pair rebounded from the 323.6% Fibonacci retracement level at 1.0532 for the second time. Today, it has returned to this level. Another rejection at this point would favor the U.S. dollar and a decline toward 1.0420. However, a consolidation above 1.0532 would increase the likelihood of further growth toward the next Fibonacci retracement level at 261.8%, located at 1.0662. The overall trend remains bearish.

The wave structure is straightforward. The last completed bullish wave failed to surpass the previous peak, while the most recent bearish wave easily broke the prior low. This pattern confirms the continuation of a bearish trend. Bulls have lost control of the market entirely, and regaining momentum will require considerable effort. To break the current trend, the pair must rise above 1.0611.
The economic news on Wednesday was weak, and price movements during the day were unrelated to it. The primary point of interest for traders was the release of the FOMC minutes, which came late in the evening. The minutes revealed that the FOMC is not in a hurry to ease monetary policy, as inflation is decreasing too slowly. However, the Federal Reserve remains confident that the consumer price index will eventually reach its target level and stabilize there. The economy continues to grow at a healthy pace and does not require additional stimulus, while the labor market remains stable. Some Fed members suggested that interest rates could remain unchanged in December. Overall, the minutes had no significant impact on trader sentiment, as the information was already widely anticipated.

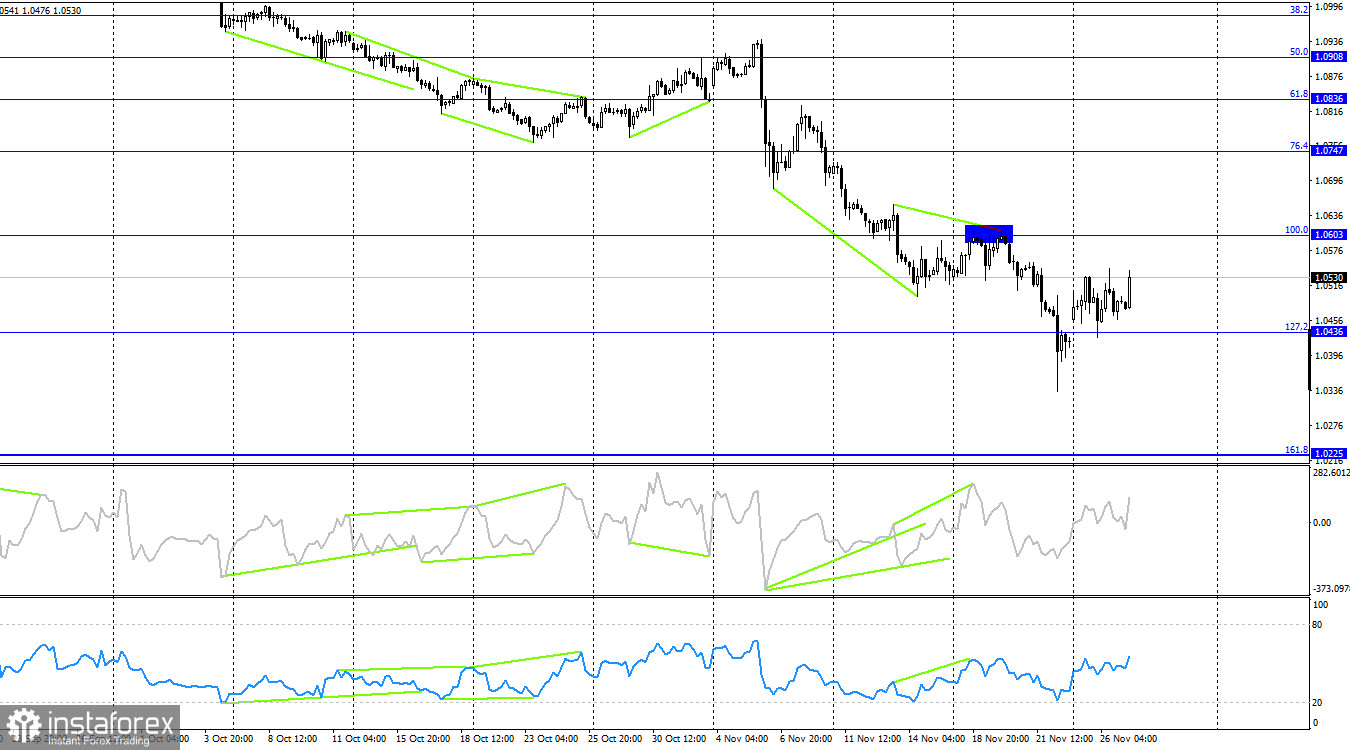
On the 4-hour chart, the pair rebounded from the 127.2% Fibonacci retracement level at 1.0436, turned in favor of the euro, and began a new upward move toward the 100.0% retracement level at 1.0603. No new divergences were observed in any technical indicators today. A consolidation below 1.0436 would favor the U.S. dollar and signal a continuation of the decline toward the 161.8% Fibonacci retracement level at 1.0225.
COT (Commitments of Traders) Report

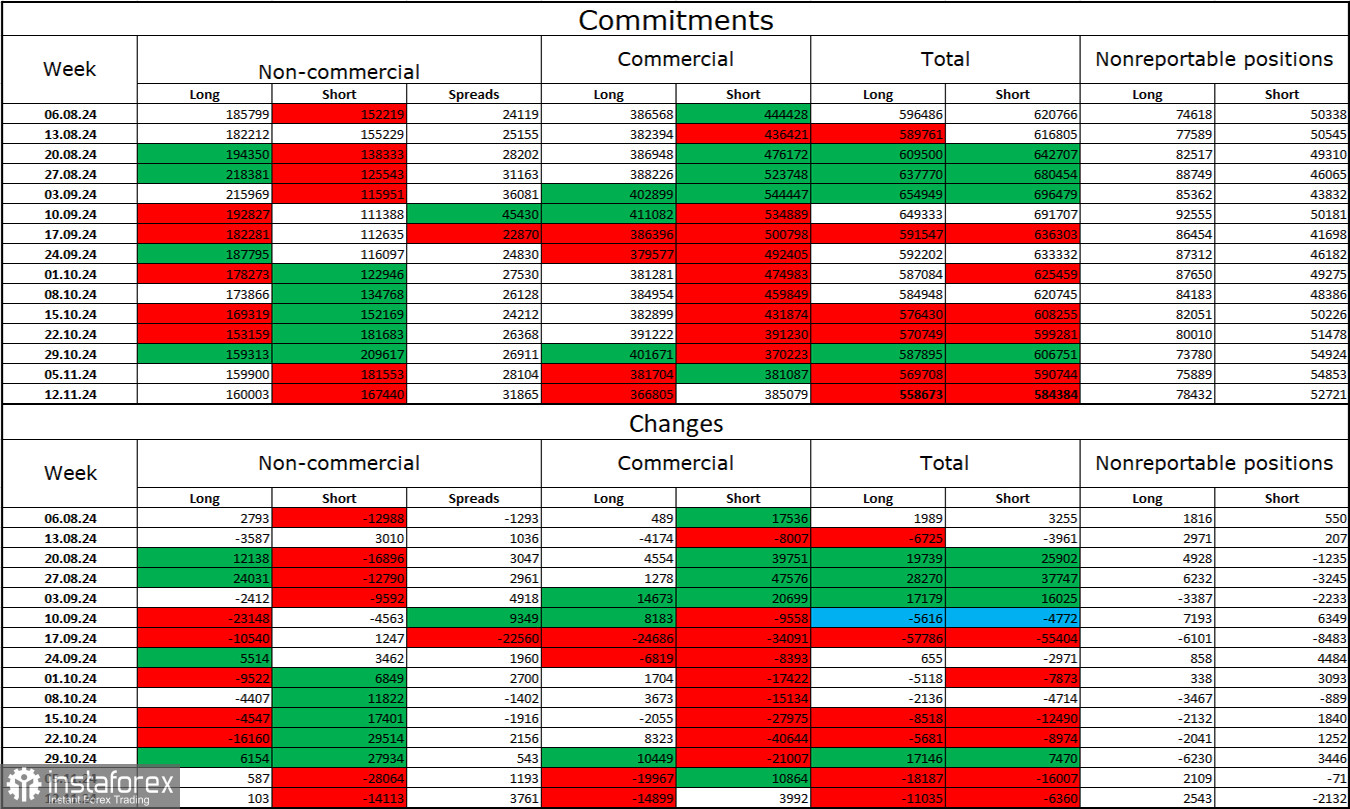
During the last reporting week, speculators opened 103 long positions and closed 14,113 short positions. This indicates that the sentiment of the "Non-commercial" group became more bearish. Speculators now hold 160,000 long positions and 167,000 short positions.
For eight consecutive weeks, large market participants have been reducing their positions in the euro. This likely reflects the development of a new bearish trend or at least a significant correction on a global scale. The primary driver for the dollar's recent decline—expectations of FOMC policy easing—has already been priced into the market, leaving no further reasons for a large-scale selloff of the dollar. While such factors might arise over time, the likelihood of continued dollar strength remains higher for now. Chart analysis also suggests the beginning of a long-term bearish trend. Consequently, I anticipate a prolonged decline in the EUR/USD pair. The latest COT data does not suggest a shift toward a bullish trend.
Economic Calendar for the U.S. and Eurozone
- U.S. – Q3 GDP Growth (13:30 UTC)
- U.S. – Core PCE Index (13:30 UTC)
- U.S. – Durable Goods Orders (13:30 UTC)
- U.S. – Personal Income and Spending (13:30 UTC)
- U.S. – Initial Jobless Claims (13:30 UTC)
On November 27, the U.S. economic calendar includes five reports, some of which are particularly important. These events may have a moderate impact on market sentiment, especially in the second half of the day.
Forecast and Trading Recommendations for EUR/USD
Sell positions are advisable in the event of a rejection on the hourly chart at 1.0532, with targets at 1.0420 and 1.0320. Buy positions could have been considered at a rebound from 1.0420 on the hourly chart (although no clear rebound occurred) or after a close above 1.0532, targeting 1.0662.
Fibonacci Levels
- Hourly chart: 1.1003–1.1214
- 4-hour chart: 1.0603–1.1214


