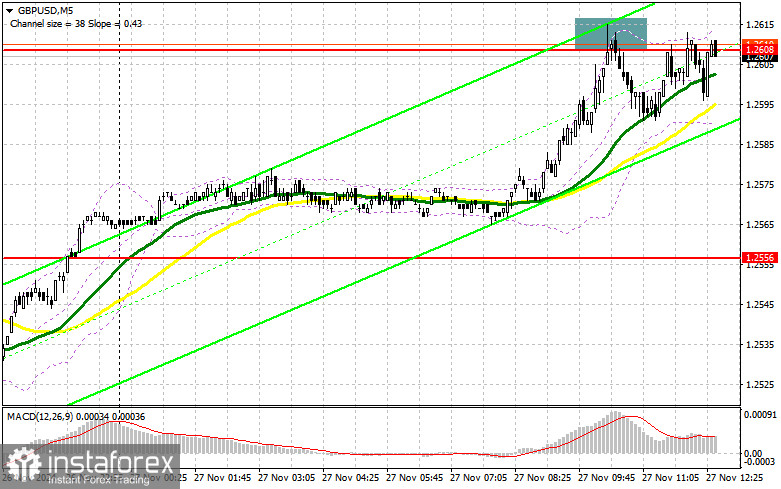
In my morning forecast, I highlighted the level of 1.2608 as a critical point for trading decisions. Let's review the 5-minute chart to analyze what happened. An upward movement followed by a false breakout around 1.2608 provided an excellent selling opportunity for the pound, resulting in a 15-point drop before demand returned. The technical outlook for the second half of the day remains unchanged, with no significant developments expected.

For Opening Long Positions on GBP/USD:
The ongoing struggle around 1.2608 for the second consecutive day underscores the importance of breaking this range. Upcoming US economic data will likely define the market's trajectory. Strong figures, such as reduced initial jobless claims, higher Q3 GDP, and an increase in the personal consumption expenditure (PCE) index, could trigger a decline in GBP/USD, creating opportunities for short trades.
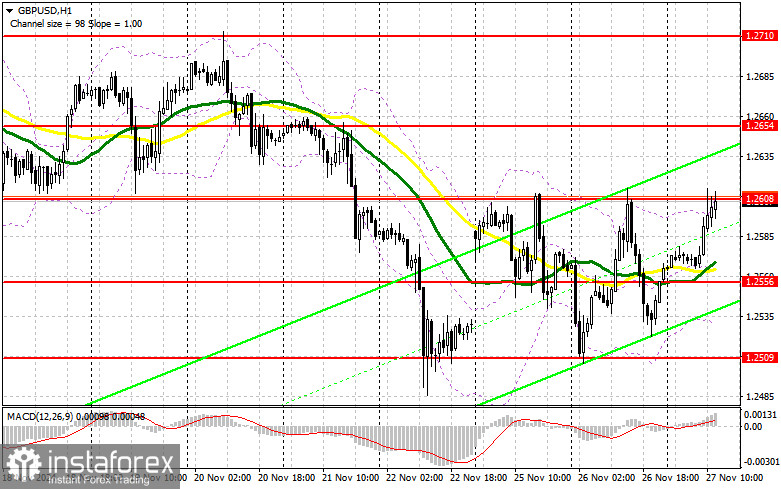
I will act after a false breakout forms near the 1.2556 support level, established by yesterday's trading results. The target will be the 1.2608 resistance, which the pair has struggled to breach. A breakout and retest of this range will create a new entry point for long positions. The initial target would be 1.2654, with an ultimate target at 1.2710, where I plan to take profits.
If GBP/USD declines further and buyers remain inactive around 1.2556, bears will have an opportunity to extend the trend. Only a false breakout around 1.2509 would justify opening long positions. Alternatively, I plan to buy GBP/USD immediately on a rebound from the 1.2464 low, targeting a 30-35 point intraday correction.
For Opening Short Positions on GBP/USD:
Pressure on the pound could reemerge following the release of strong US economic data. A false breakout around 1.2608, combined with news of rising inflationary pressures in the US, would create an ideal entry point for selling, targeting a drop toward the 1.2556 support level.
A breakout and retest of this range from below would eliminate buyers' chances and potentially trigger stop-loss orders, opening the way to the 1.2509 low. The final target would be the 1.2464 area, where I plan to take profits.
If GBP/USD rises in the second half of the day without bear activity around 1.2608, buyers could push the pair toward further correction. In that case, bears would retreat to the 1.2654 resistance. I will sell at this level only after a failed consolidation. If there is no downward movement there, I will consider short positions on a rebound from 1.2710, targeting a 30-35 point intraday correction.

Commitments of Traders (COT) Report:
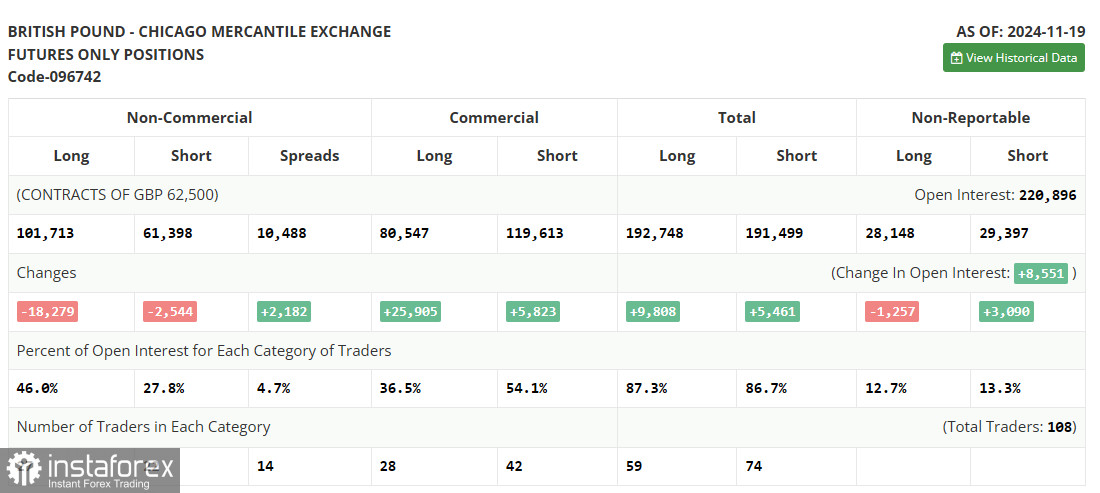
The COT report for November 19 showed a reduction in both long and short positions. The current figures already account for Donald Trump's presidency, but the Bank of England's apparent decision to halt further interest rate cuts has yet to be fully reflected in the market, despite being evident. This policy contradicts the government's efforts to sustain growth, which recent PMI data suggests may be unattainable.
Traders are responding to this uncertainty by refraining from buying the pound. However, it's worth noting that the number of pound sellers isn't increasing either. This could indicate an initial slowdown in the pair's bearish trend. The latest COT report shows non-commercial long positions decreased by 18,279 to 101,713, while short positions fell by 2,544 to 61,398. As a result, the spread between long and short positions increased by 2,182.

Indicator Signals:
Moving Averages:Trading is occurring above the 30- and 50-day moving averages, indicating a bullish correction in the pair.
Bollinger Bands:In the event of a decline, the lower boundary of the indicator near 1.2520 will act as support.
Indicator Descriptions:
- Moving Average (MA): Smooths volatility and noise to identify the current trend. Periods: 50 (yellow) and 30 (green) on the chart.
- MACD (Moving Average Convergence Divergence): Fast EMA – period 12, slow EMA – period 26, SMA – period 9.
- Bollinger Bands: A volatility indicator with a period of 20.
- Non-commercial traders: Speculators, such as individual traders, hedge funds, and institutions, using futures for speculative purposes.
- Non-commercial long positions: The total number of open long positions held by non-commercial traders.
- Non-commercial short positions: The total number of open short positions held by non-commercial traders.
- Net non-commercial positions: The difference between non-commercial short and long positions.


