Analysis of Trades and Trading Advice for the Japanese Yen
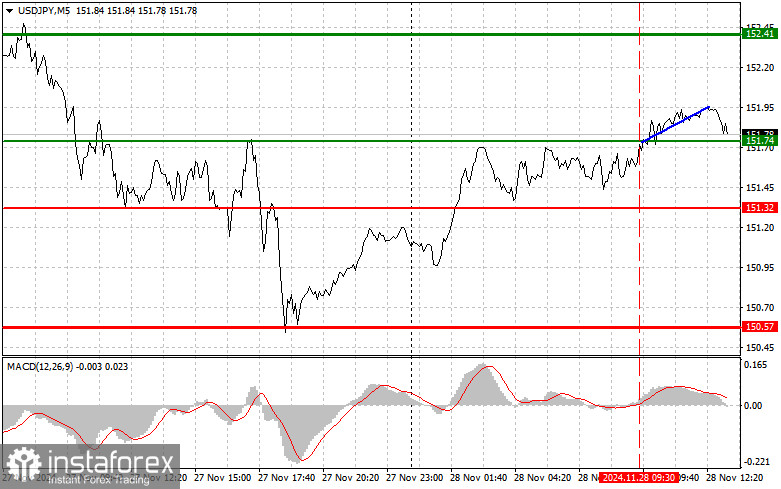
The test of the 151.74 price level in the first half of the day coincided with the MACD indicator beginning to rise above the zero line, confirming a suitable buying opportunity for the dollar. As a result, the pair rose by 20 points before the upward correction ended. It is important to remember that the USD/JPY pair is in a strong downtrend, so trading in line with the trend is more effective than trading against it. With US markets closed today for Thanksgiving, substantial further growth in the pair is unlikely. Selling the dollar in line with the prevailing trend, particularly at higher levels, remains the most prudent approach. For intraday trading, I will focus on implementing Scenario #1 and Scenario #2.

Buy Signal
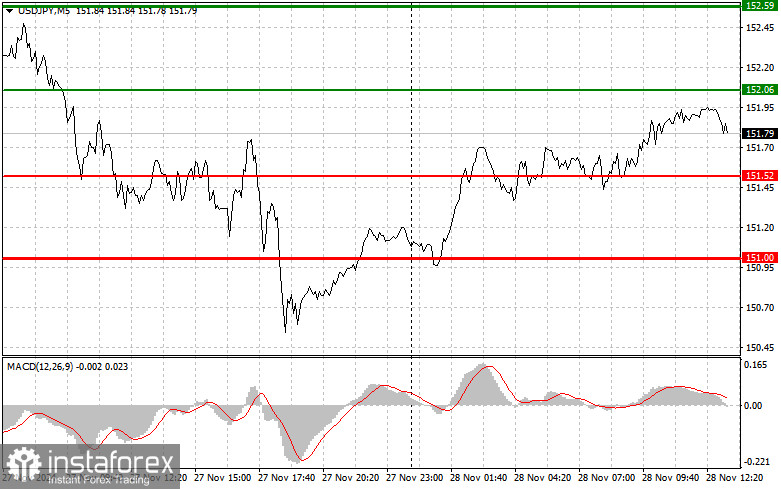
Scenario #1:I plan to buy USD/JPY today at 152.06 (green line on the chart), aiming for a target of 152.59 (thicker green line on the chart). At 152.59, I will close long positions and initiate short positions, expecting a 30–35 point move downward. Growth should be anticipated solely as part of a corrective movement. It is important to ensure that the MACD indicator is above the zero line and just starting to rise before buying.
Scenario #2:I also plan to buy USD/JPY today if the 151.52 price level is tested twice consecutively, with the MACD indicator in the oversold zone. This setup will likely limit the pair's downward potential and result in a market reversal upward. Growth to 152.06 and 152.59 can be expected.
Sell Signal
Scenario #1:I plan to sell USD/JPY today after breaking below the 151.52 level (red line on the chart), which will likely lead to a quick decline in the pair. The key target for sellers will be 151.00, where I will close short positions and open long positions, expecting a 20–25 point upward correction. The stronger the correction, the better the selling opportunity. It is important to ensure that the MACD indicator is below the zero line and just starting to decline before selling.
Scenario #2:I also plan to sell USD/JPY today if the 152.06 price level is tested twice consecutively, with the MACD indicator in the overbought zone. This setup will likely limit the pair's upward potential and trigger a downward reversal. A decline to 151.52 and 151.00 can be expected.

What's on the Chart:
- Thin green line: Entry price for buying the trading instrument.
- Thick green line: Estimated price for setting Take Profit or manually fixing profits, as further growth above this level is unlikely.
- Thin red line: Entry price for selling the trading instrument.
- Thick red line: Estimated price for setting Take Profit or manually fixing profits, as further declines below this level are unlikely.
- MACD Indicator: When entering the market, it is crucial to use overbought and oversold zones.
Important Notes for Beginner Traders:
Forex beginners should exercise extreme caution when entering the market, particularly during volatile conditions. Before major fundamental reports, it is best to stay out of the market to avoid sharp price fluctuations. If trading during news releases, always use stop-loss orders to minimize losses. Without stop-losses, you risk losing your entire deposit quickly, especially if trading with large volumes.
Remember: Successful trading requires a clear trading plan, such as the one outlined above. Making impulsive trading decisions based on current market conditions is generally a losing strategy for intraday traders.


