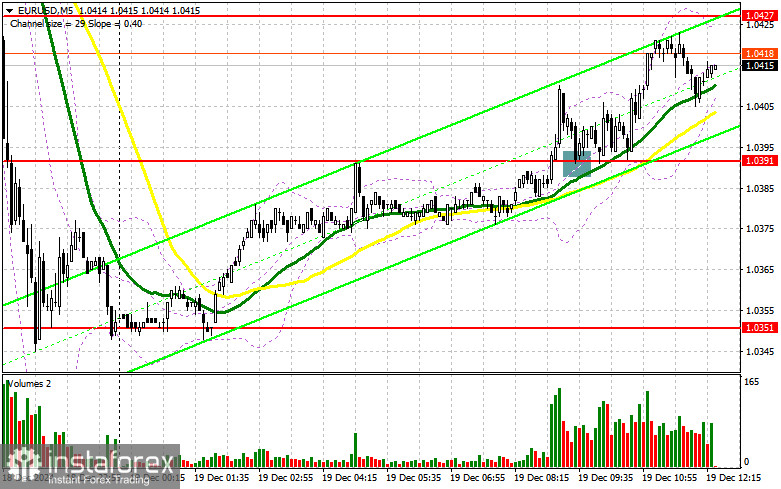
In my morning forecast, I highlighted the level of 1.0391 and planned to make trading decisions based on it. Let's look at the 5-minute chart and analyze what happened. A breakout and subsequent retest of this level from above created an excellent entry point for buying the euro, leading to a 30-point rise in the pair. The technical picture has been revised for the second half of the day.

For Opening Long Positions on EUR/USD
The lack of significant statistics and attractive euro prices contributed to a decent upward correction in the EUR/USD pair during the first half of the day. However, whether this trend will continue during the US session remains uncertain. Several important data points are expected, which could renew demand for the dollar. Initial jobless claims, Q3 GDP growth, and existing home sales will play a crucial role in determining the dollar's direction.
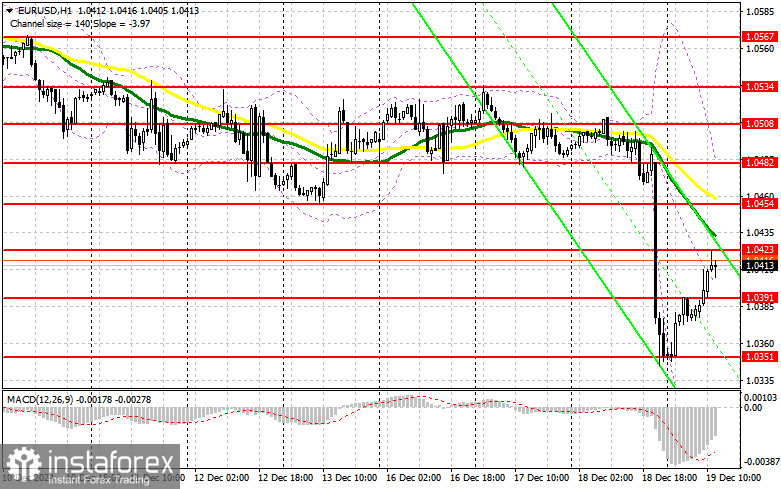
In case of strong statistics and a decline in the pair, a false breakout near 1.0391—support formed earlier today—would provide a good setup for increasing long positions, aiming for a return to the 1.0423 level, which the pair has yet to break above. A breakout and retest of this range would confirm a proper entry point for buying with a target of 1.0454. The ultimate target will be the 1.0482 high, where profits will be fixed.
If EUR/USD declines and there is no bullish activity near 1.0391, pressure on the pair will only increase, leading to a larger drop. In this case, I will enter long positions only after a false breakout near the weekly low and support at 1.0351. I plan to open immediate buy positions from 1.0308, targeting an intraday correction of 30–35 points.
For Opening Short Positions on EUR/USD
If the euro rises on weak US data, protecting the 1.0423 resistance—formed during the first half of the day—will be a top priority for sellers. A false breakout at this level would allow bearish momentum to resume, providing an entry point for short positions with a target of 1.0391. A breakout and consolidation below this range, along with a retest from below, would present another good selling opportunity, targeting the 1.0351 low. A move to this level would nullify buyers' plans for further corrections. The ultimate target will be 1.0308, where profits will be fixed.
If EUR/USD rises in the second half of the day and bears do not show activity near 1.0423, where moving averages favor sellers, I will delay selling until the next resistance at 1.0454. I will also sell at this level but only after an unsuccessful consolidation. Immediate short positions will be considered at 1.0482, targeting a downward correction of 30–35 points.

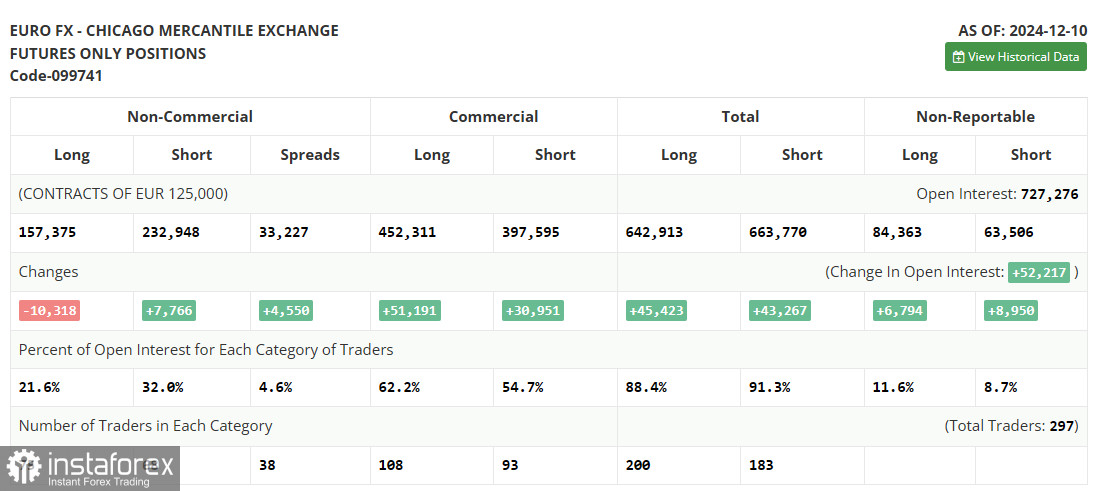
In the COT (Commitment of Traders) report for December 10, there was an increase in short positions and a reduction in long positions. Overall, the new data kept market sentiment relatively unchanged. The upcoming final meeting of the Federal Reserve this year is expected to decide on rate cuts, which have recently limited the dollar's growth while maintaining demand for risk assets. If the Fed takes a more cautious approach for next year, the chances of a bearish market returning to EUR/USD could increase significantly. According to the COT report, non-commercial long positions fell by 10,318 to 157,375, while short positions increased by 7,766 to 232,948, widening the gap between long and short positions by 4,450.

Indicator Signals
Moving Averages:The pair is trading below the 30- and 50-day moving averages, indicating further downward potential.
Note: The author considers the periods and prices of moving averages on the H1 chart, which differ from the classic definitions on the daily D1 chart.
Bollinger Bands:In case of a decline, the lower boundary of the indicator near 1.0310 will act as support.
Indicator Descriptions:
- Moving average: Determines the current trend by smoothing volatility and noise. Period – 50 (yellow on the chart); Period – 30 (green on the chart).
- MACD Indicator (Moving Average Convergence/Divergence): Fast EMA – 12, Slow EMA – 26, SMA – 9.
- Bollinger Bands: Period – 20.
- Non-commercial traders: Speculators such as individual traders, hedge funds, and institutions using the futures market for speculative purposes and meeting specific requirements.
- Non-commercial long positions: Total long positions held by non-commercial traders.
- Non-commercial short positions: Total short positions held by non-commercial traders.
- Non-commercial net position: The difference between short and long positions held by non-commercial traders.


